Graphics Programs Reference
In-Depth Information
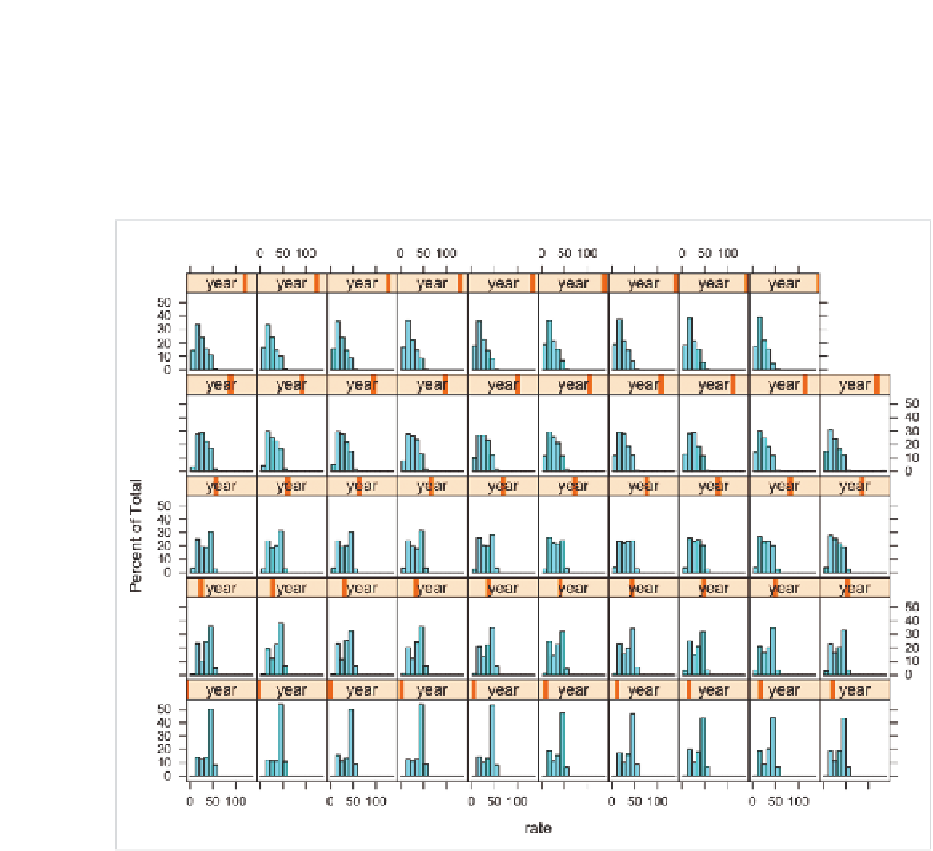
Now plug the data into
histogram()
to make a 10 by 5 matrix, with rate cat-
egorized by year. The output is shown in Figure 6-33.
histogram(~ rate | year, data=birth_yearly, layout=c(10,5))
FIGurE 6-33
Default histogram matrix
Okay, not bad, but you can improve it. First, there is an outlier on the far
right that's pushing all the bars to the left. Second, an orange bar shifts
left and right according to the year for each cell of the matrix, but it'd be
easier to read if those were actually labels that showed the year number.
Finally, it's hard to tell because there are no year labels, but the order of
the histograms isn't actually working. The irst year, 1960, is at the bot-
tom left, and 1969 is at the bottom right. The cell above 1960 is the one for
1970. So the order is going bottom to top and left to right. Weird.

Search WWH ::

Custom Search