Graphics Programs Reference
In-Depth Information
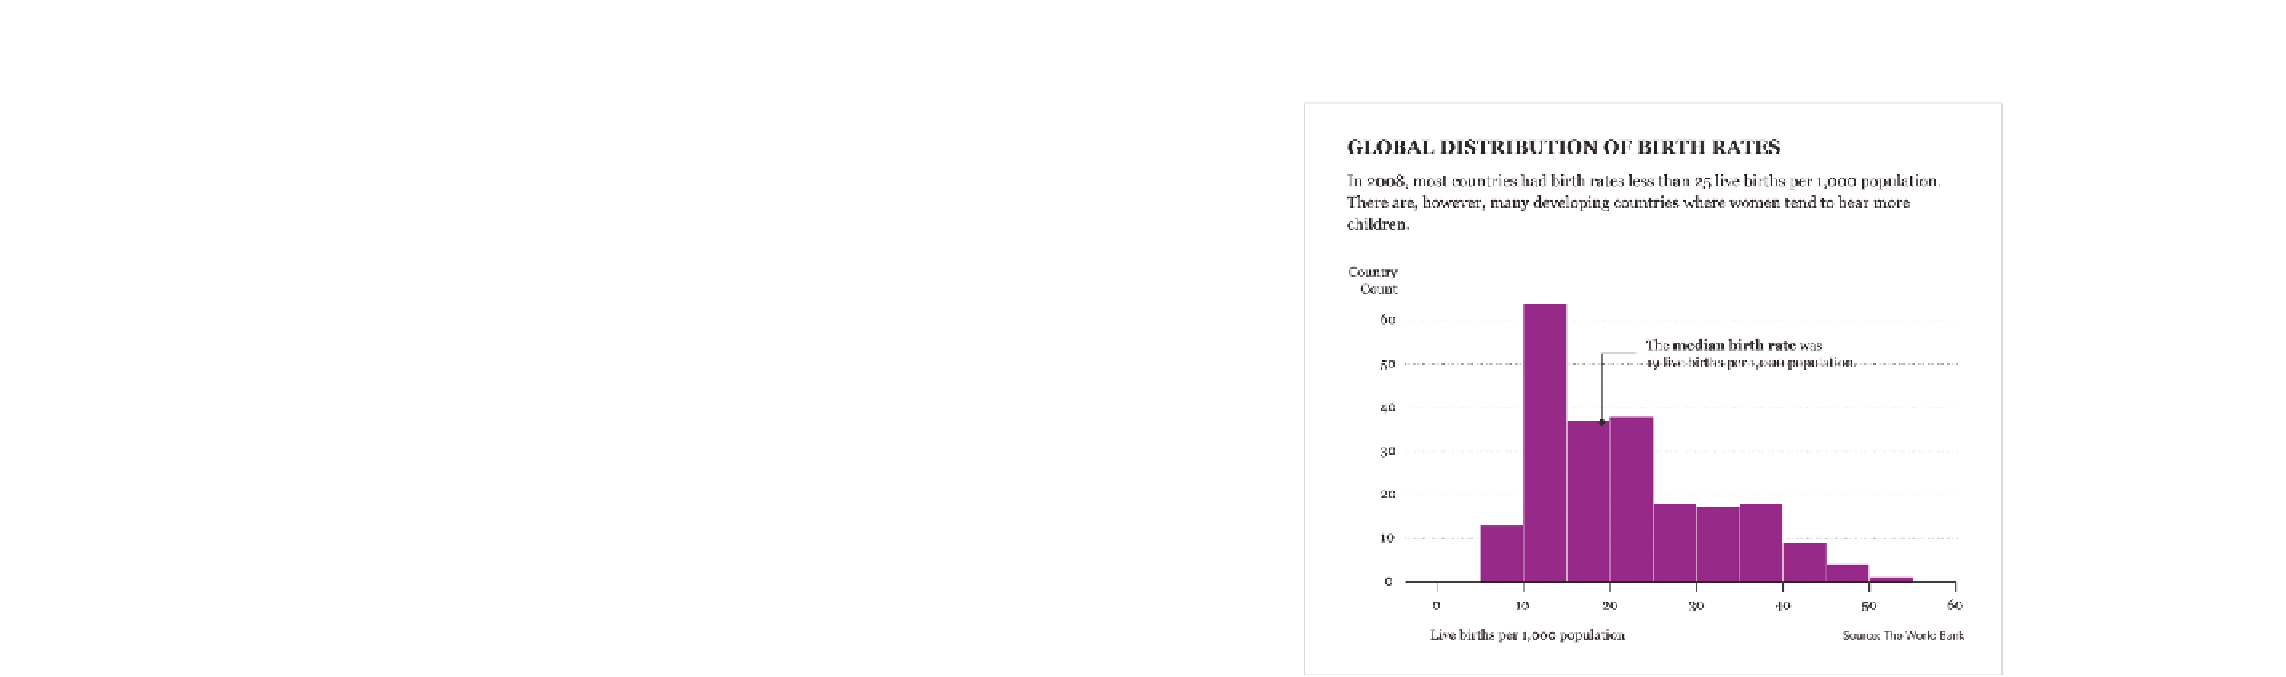
FIGurE 6-24
Distribution of birth rates worldwide
Assuming you've already loaded the data from your previous example, run
the
hist()
function with the same numbers from 2008.
hist(birth$X2008)
This is the default histogram shown in Figure 6-25.
There are ten bars or ranges in the default histogram, but you can change
that to what you like with the
breaks
argument. For example, you could
have fewer, wider bars, as shown in Figure 6-26. It has only five breaks.
hist(birth$X2008, breaks=5)
You can also go the other way and make a histogram with more skinny
bars, say 20 of them (Figure 6-27).
hist(birth$X2008, breaks=20)

Search WWH ::

Custom Search