Graphics Programs Reference
In-Depth Information
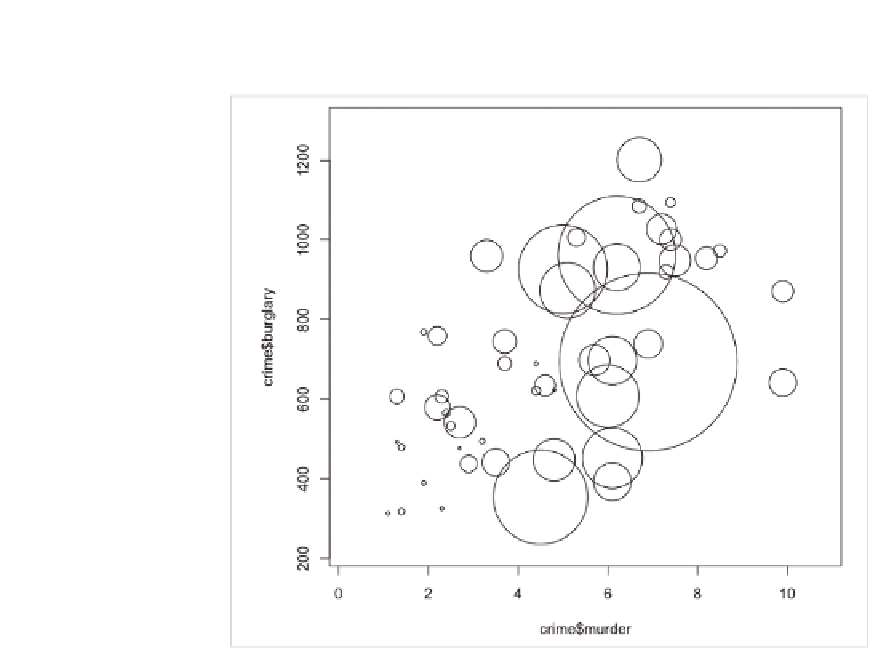
FIGurE 6-16
Default bubble chart
All done, right? Wrong. That was a test. The preceding sizes the circles
such that population is proportional to the radius. You need to size the cir-
cles proportional to the area. The relative proportions are all out of whack
if you size by radius. Is California's population, represented by that giant
circle in the middle, that much higher than that of all of the other states?
To size radiuses correctly, look to the equation for the area of a circle.
Area of circle =
π
r
2
The area of each bubble represents population. What you need to find out
is how to size the radius, so isolate the radius to find that it should be pro-
portional to the square root of the area.
r =
√
(Area of circle /
π
)
You can actually get rid of the
π
altogether because it's a constant, but leave
it in there for the sake of clarity. Now instead of using
crime$population
to
size the circle radiuses, find the square root and then plug it into
symbols()
.
radius <- sqrt( crime$population/ pi )
symbols(crime$murder, crime$burglary, circles=radius)

Search WWH ::

Custom Search