Graphics Programs Reference
In-Depth Information
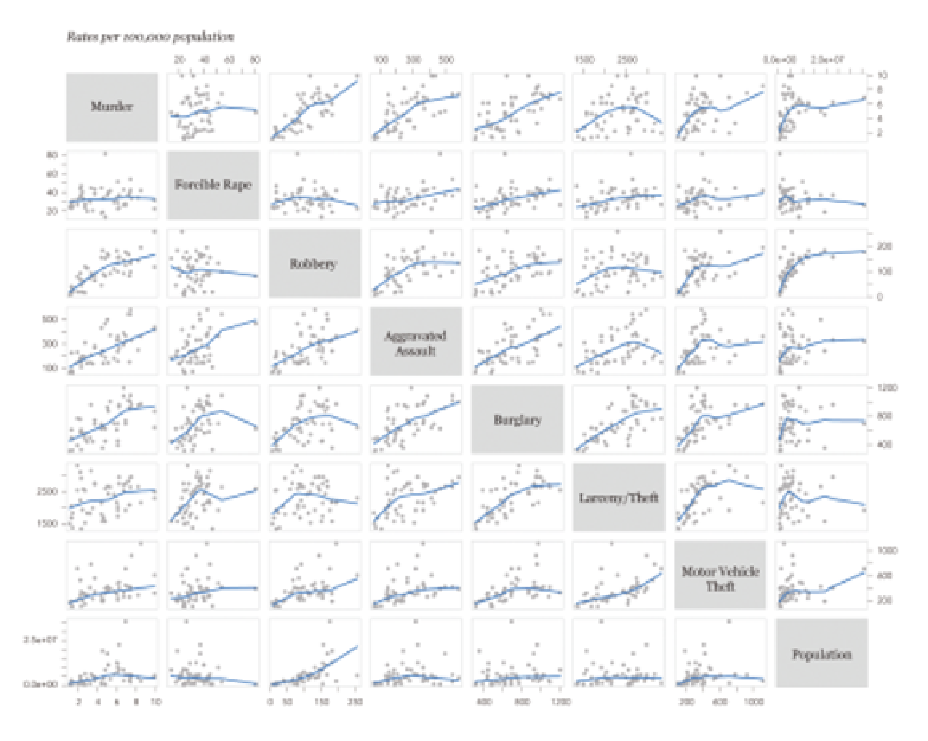
FIGurE 6-9
Scatterplot matrix of crime rates
To create a scatterplot matrix with fitted LOeSS curves, you can use the
pairs()
function instead, but it's equally as simple to call. The result is
shown in Figure 6-11.
pairs(crime2[,2:9], panel=panel.smooth)
The panel argument in
pairs()
takes a function of x and y. In this
example, you use
panel.smooth()
, which is a native function in R and
results in a LOESS curve. You can also specify your own function.


Search WWH ::

Custom Search