Graphics Programs Reference
In-Depth Information
Exploring More Variables
Now that you've plotted two variables against each other, the obvious next
step is to compare other variables. You could pick and choose the vari-
ables you want to compare and make a scatterplot for each pair, but that
could easily lead to missed opportunities and ignoring interesting spots in
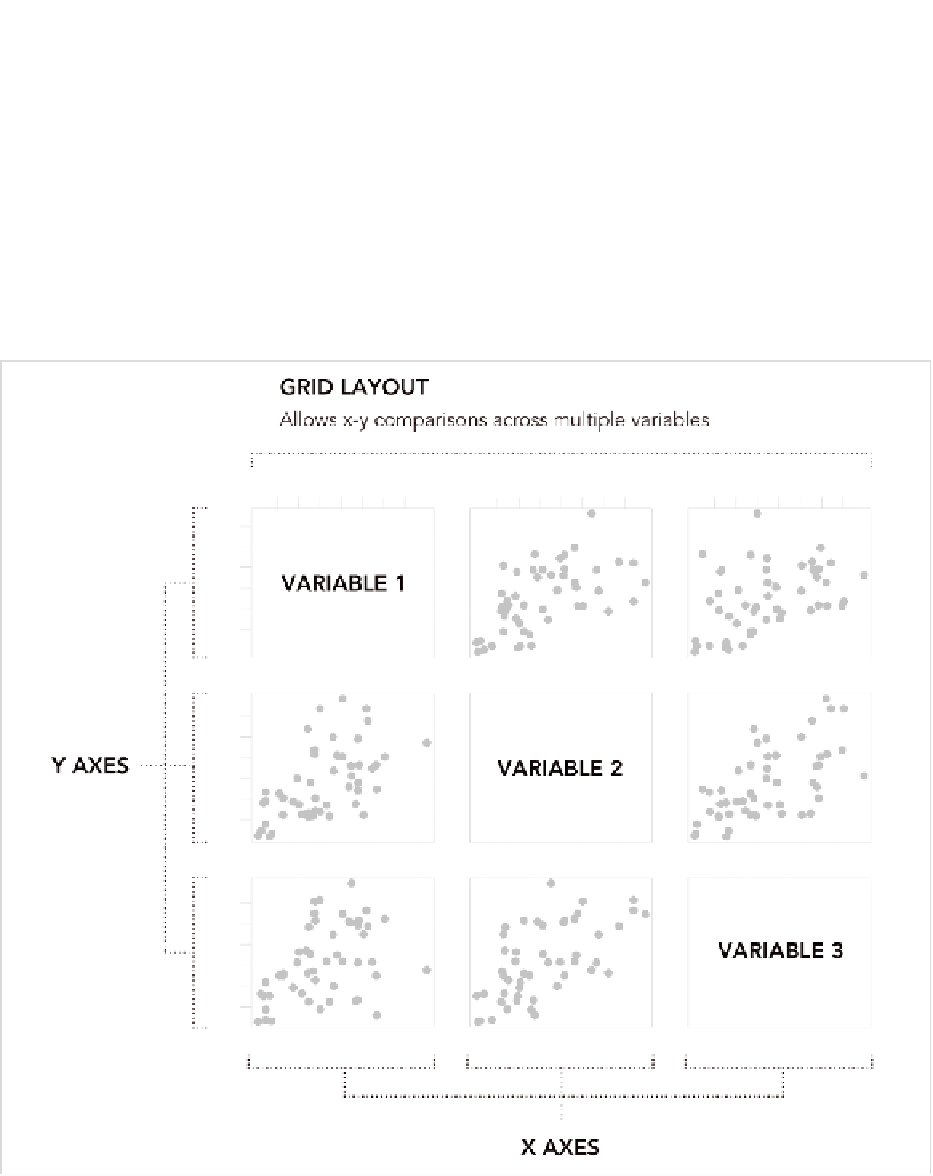
the data. You don't want that. So instead, you can plot every possible pair
with a scatterplot matrix, as shown in Figure 6-8.
FIGurE 6-8
Scatterplot matrix framework

Search WWH ::

Custom Search