Graphics Programs Reference
In-Depth Information
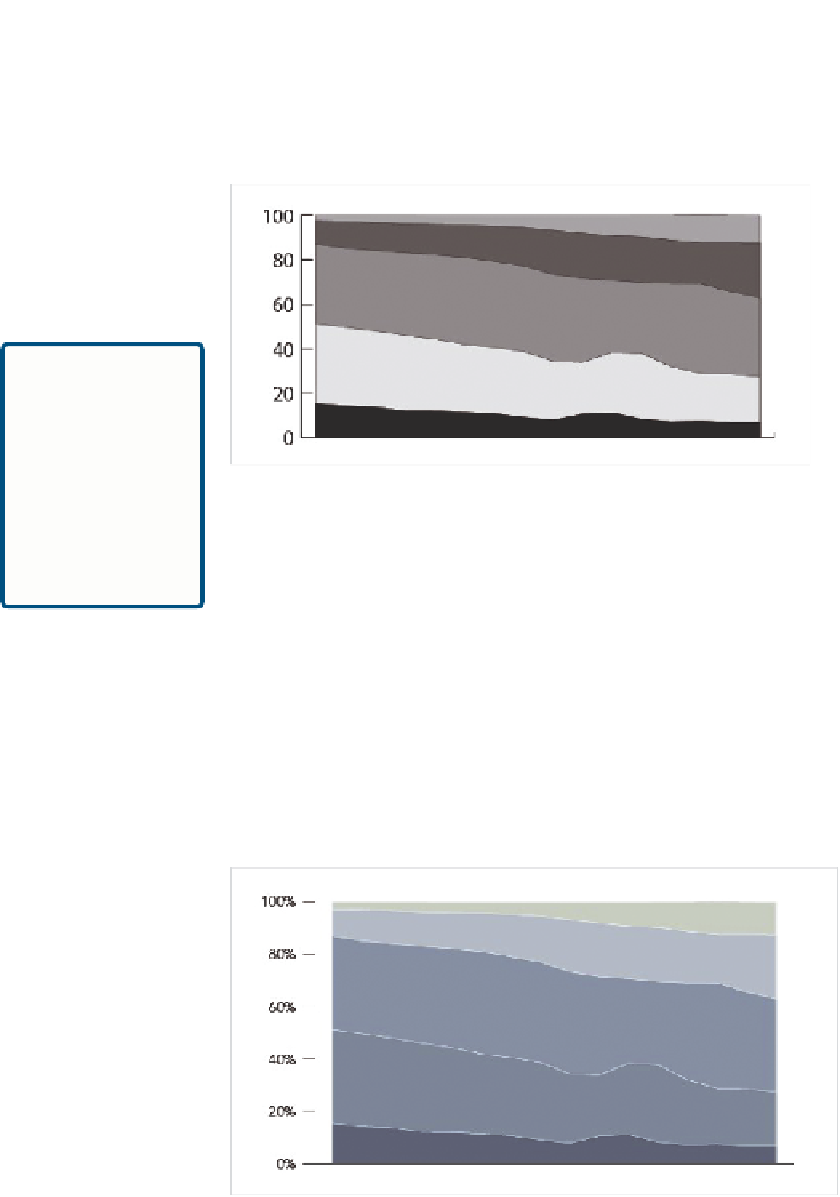
in Figure 5-23. Although, you probably entered the data correctly the first
time, so you're already here.
Be careful when
you enter data
manually. A lot
of silly mistakes
come from
transferring data
from one source
to another.
FIGurE 5-23
Fixed area chart
Keep an eye out for stuff like this in your graph design though. It's better to
spot typos and small data entry errors in the beginning than it is to finish a
design and have to backtrack to figure out where things went wrong.
Now that you have a proper base, clean up the axis and lines. Make use of
the Direct Selection tool to select specific elements. I like to remove the
vertical axis line and leave thinner tick marks for a cleaner, less clunky
look, and add the percentage sign to the numbers because that's what
we're dealing with. I also typically change the stroke color of the actual
graph fills from the default black to a simpler white. Also bring in some
shades of blue. That takes you to Figure 5-24.
FIGurE 5-24
Modified colors from default


Search WWH ::

Custom Search