Graphics Programs Reference
In-Depth Information
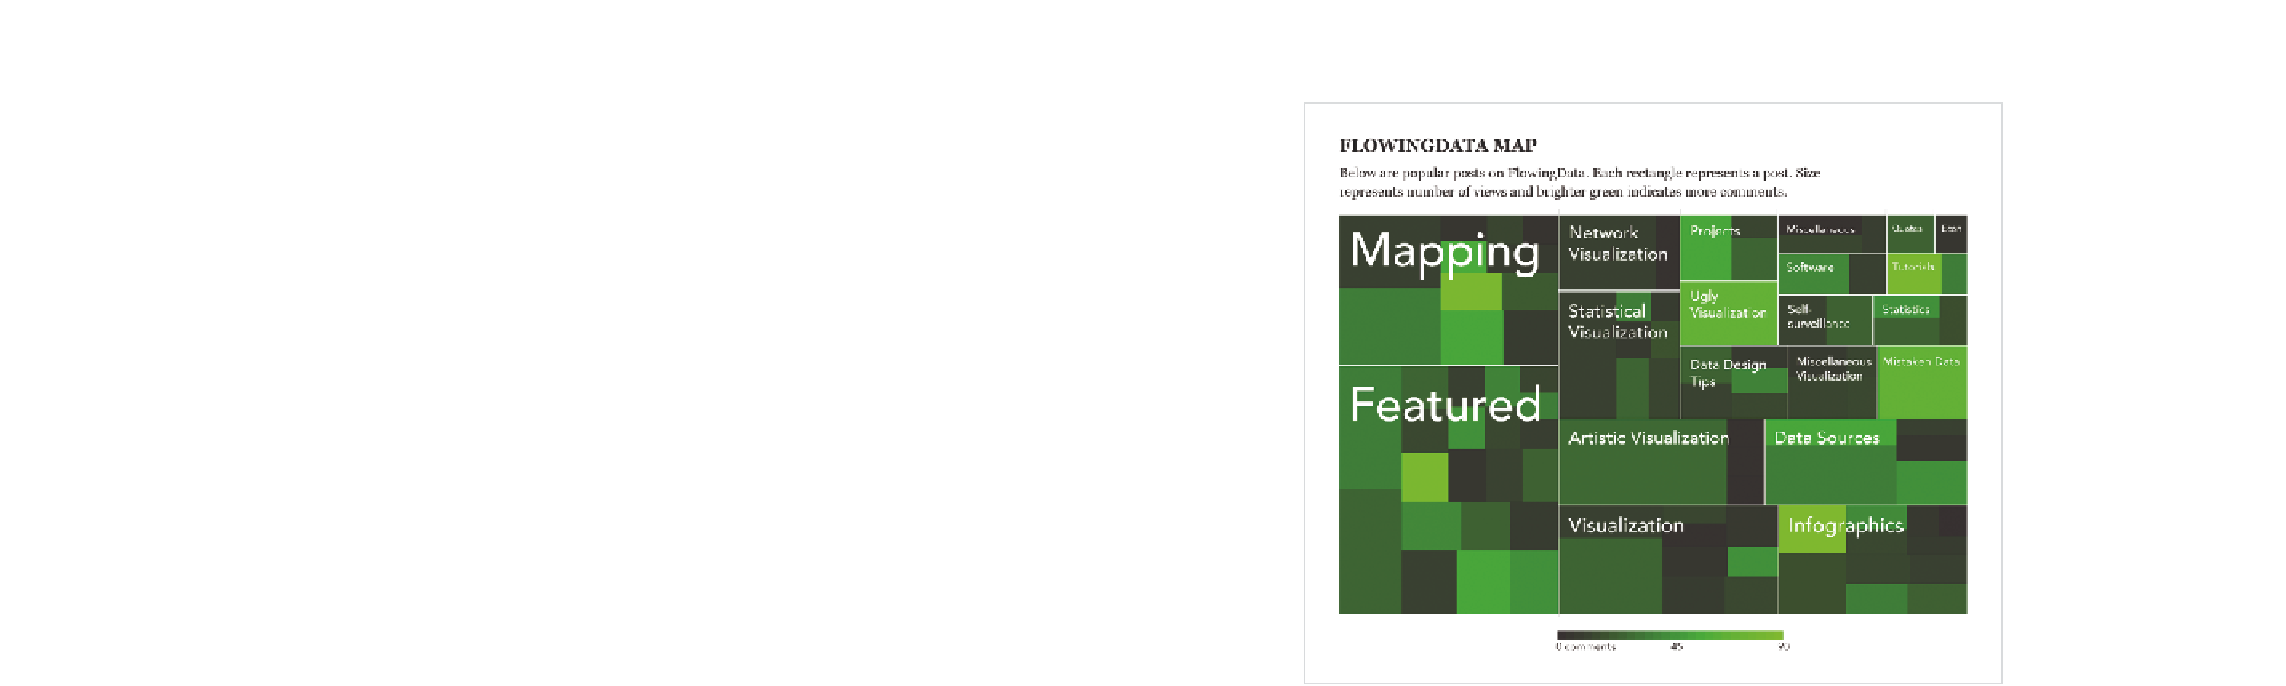
FIGurE 5-19
Revised treemap from R to Illustrator
Proportions over Time
Often you'll have a set of proportions over time. Instead of results for a
series of questions from a single polling session, you might have results
from the same poll run every month for a year. You're not just interested in
individual poll results; you also want to see how views have changed over
time. How has opinion changed from one year ago until now?
This doesn't just apply to polls, of course. There are plenty of distribu-
tions that change over time. In the following examples, you take a look at
the distribution of age groups in the United States from 1860 to 2005. With
improving healthcare and average family size shrinking, the population as
a whole is living longer than the generation before.


Search WWH ::

Custom Search