Graphics Programs Reference
In-Depth Information
The main thing
to remember,
whether you use
a pie chart or
donut chart, is that
they can quickly
become cluttered.
They're not meant
to represent a lot
of values.
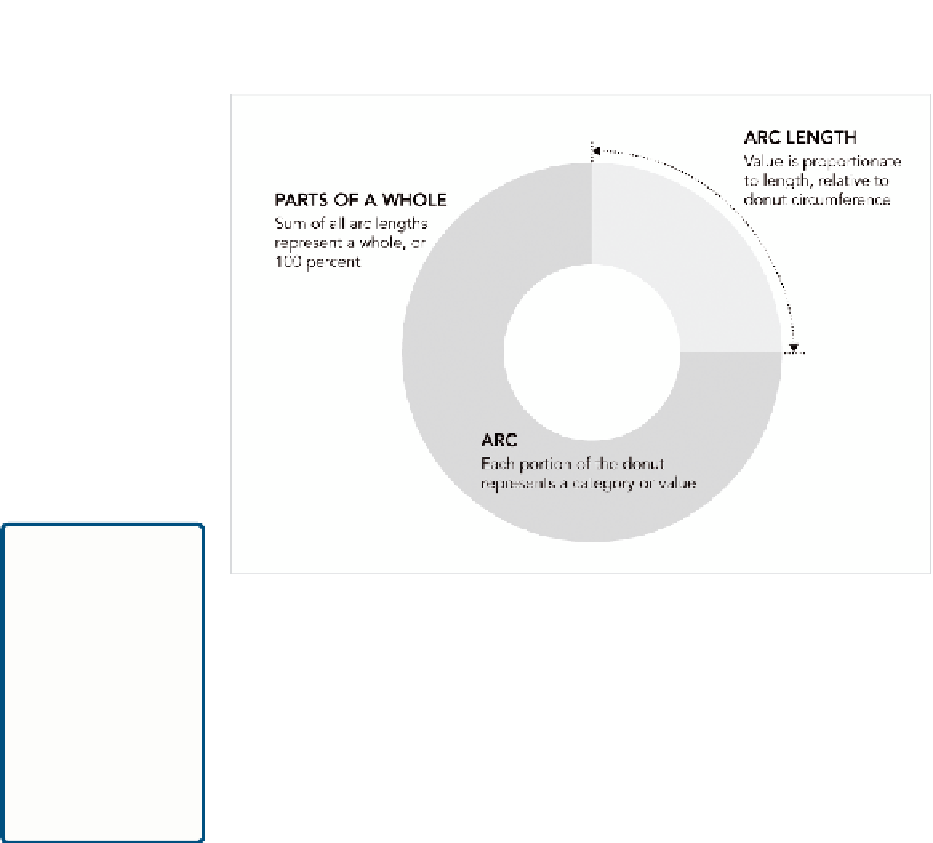
FIGurE 5-8
Donut chart framework
Because there's a hole in the middle, you don't judge values by angle any-
more. Instead you use arc length. This introduces many of the same prob-
lems when you use a single chart with too many categories, but in cases
with fewer categories the donut chart can still come in handy.
CrEATE A DoNuT ChArT
It's straightforward to make a donut chart in Illustrator. Create a pie chart
like you just did; then put a filled circle in the middle, as shown in Fig-
ure 5-9. Again, use color to guide readers' eyes.
P
Download
Protovis at
http://
vis.stanford.edu/
protovis/
and
put it in the same
directory that
you use to save
example files.
A lot of the time the middle of donut charts are used for a label or some
other content like was done in the figure.
Now make the same chart using Protovis, the free and open-source visu-
alization toolkit. It's a library implemented in JavaScript and makes use of
modern browsers' Scalable Vector Graphics (SVG) capabilities. Graphics
are generated dynamically and enable animation and interactivity, which
makes Protovis great for online graphics.


Search WWH ::

Custom Search