Graphics Programs Reference
In-Depth Information
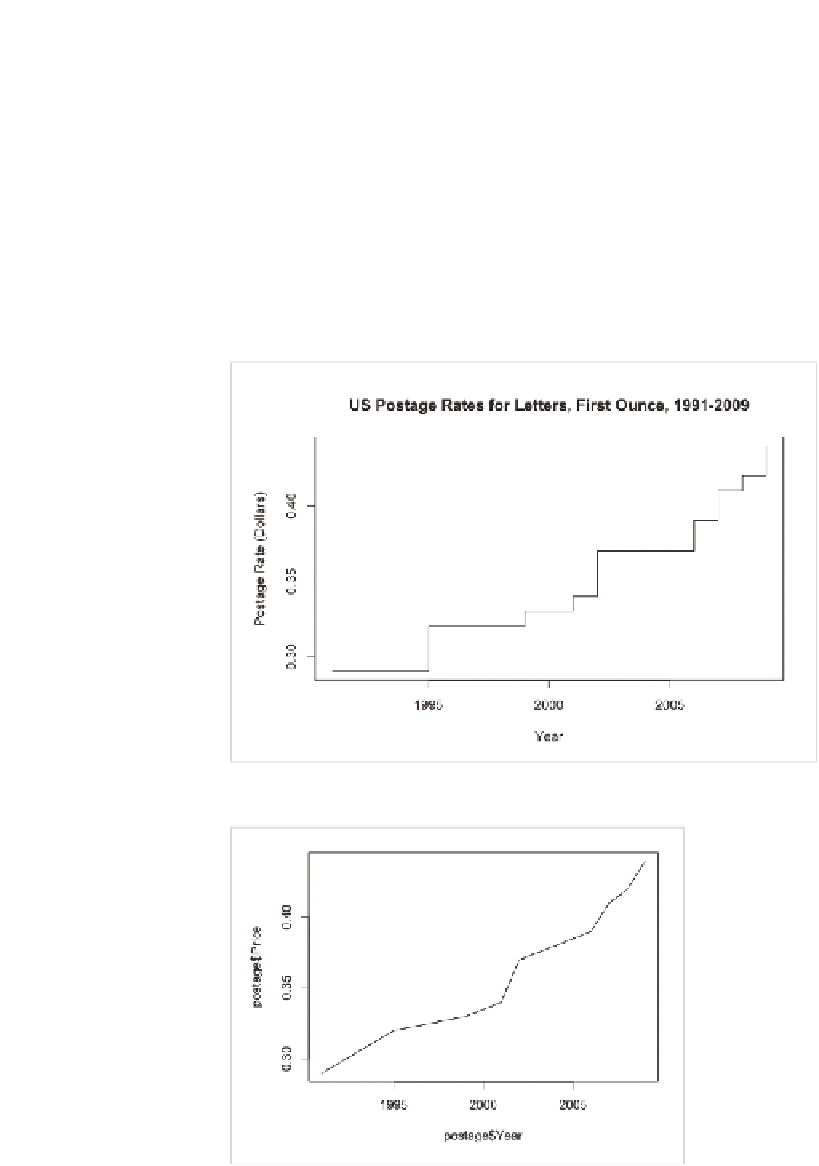
This gives you the step chart for postage rate, as shown in Figure 4-43.
Just for fun, see what the graph would like if you used a line plot instead
(Figure 4-44).
There's an increasing trend, but notice how it looks like it was a steady
increase? At no point during 2001 and 2006 was the rate at 38 cents,
but you wouldn't know that from the line plot unless you looked at the
raw data.
FIGurE 4-43
Step chart created in R
FIGurE 4-44
Line plot of postage rates

Search WWH ::

Custom Search