Graphics Programs Reference
In-Depth Information
The main takeaway here is that you can make the same graph in both
Illustrator and R—you still would have the same end result no matter. To
that end, figure out what you're comfortable with tool-wise and go with it.
The most important part is getting results.
Step It Up
One of the drawbacks of the standard line plot is that it implies steady
change from point A to point B. That's about right with a measure like
world population, but some things stay at a value for a long time and then
all of a sudden see a boost or a decline. Interest rates, for example, can
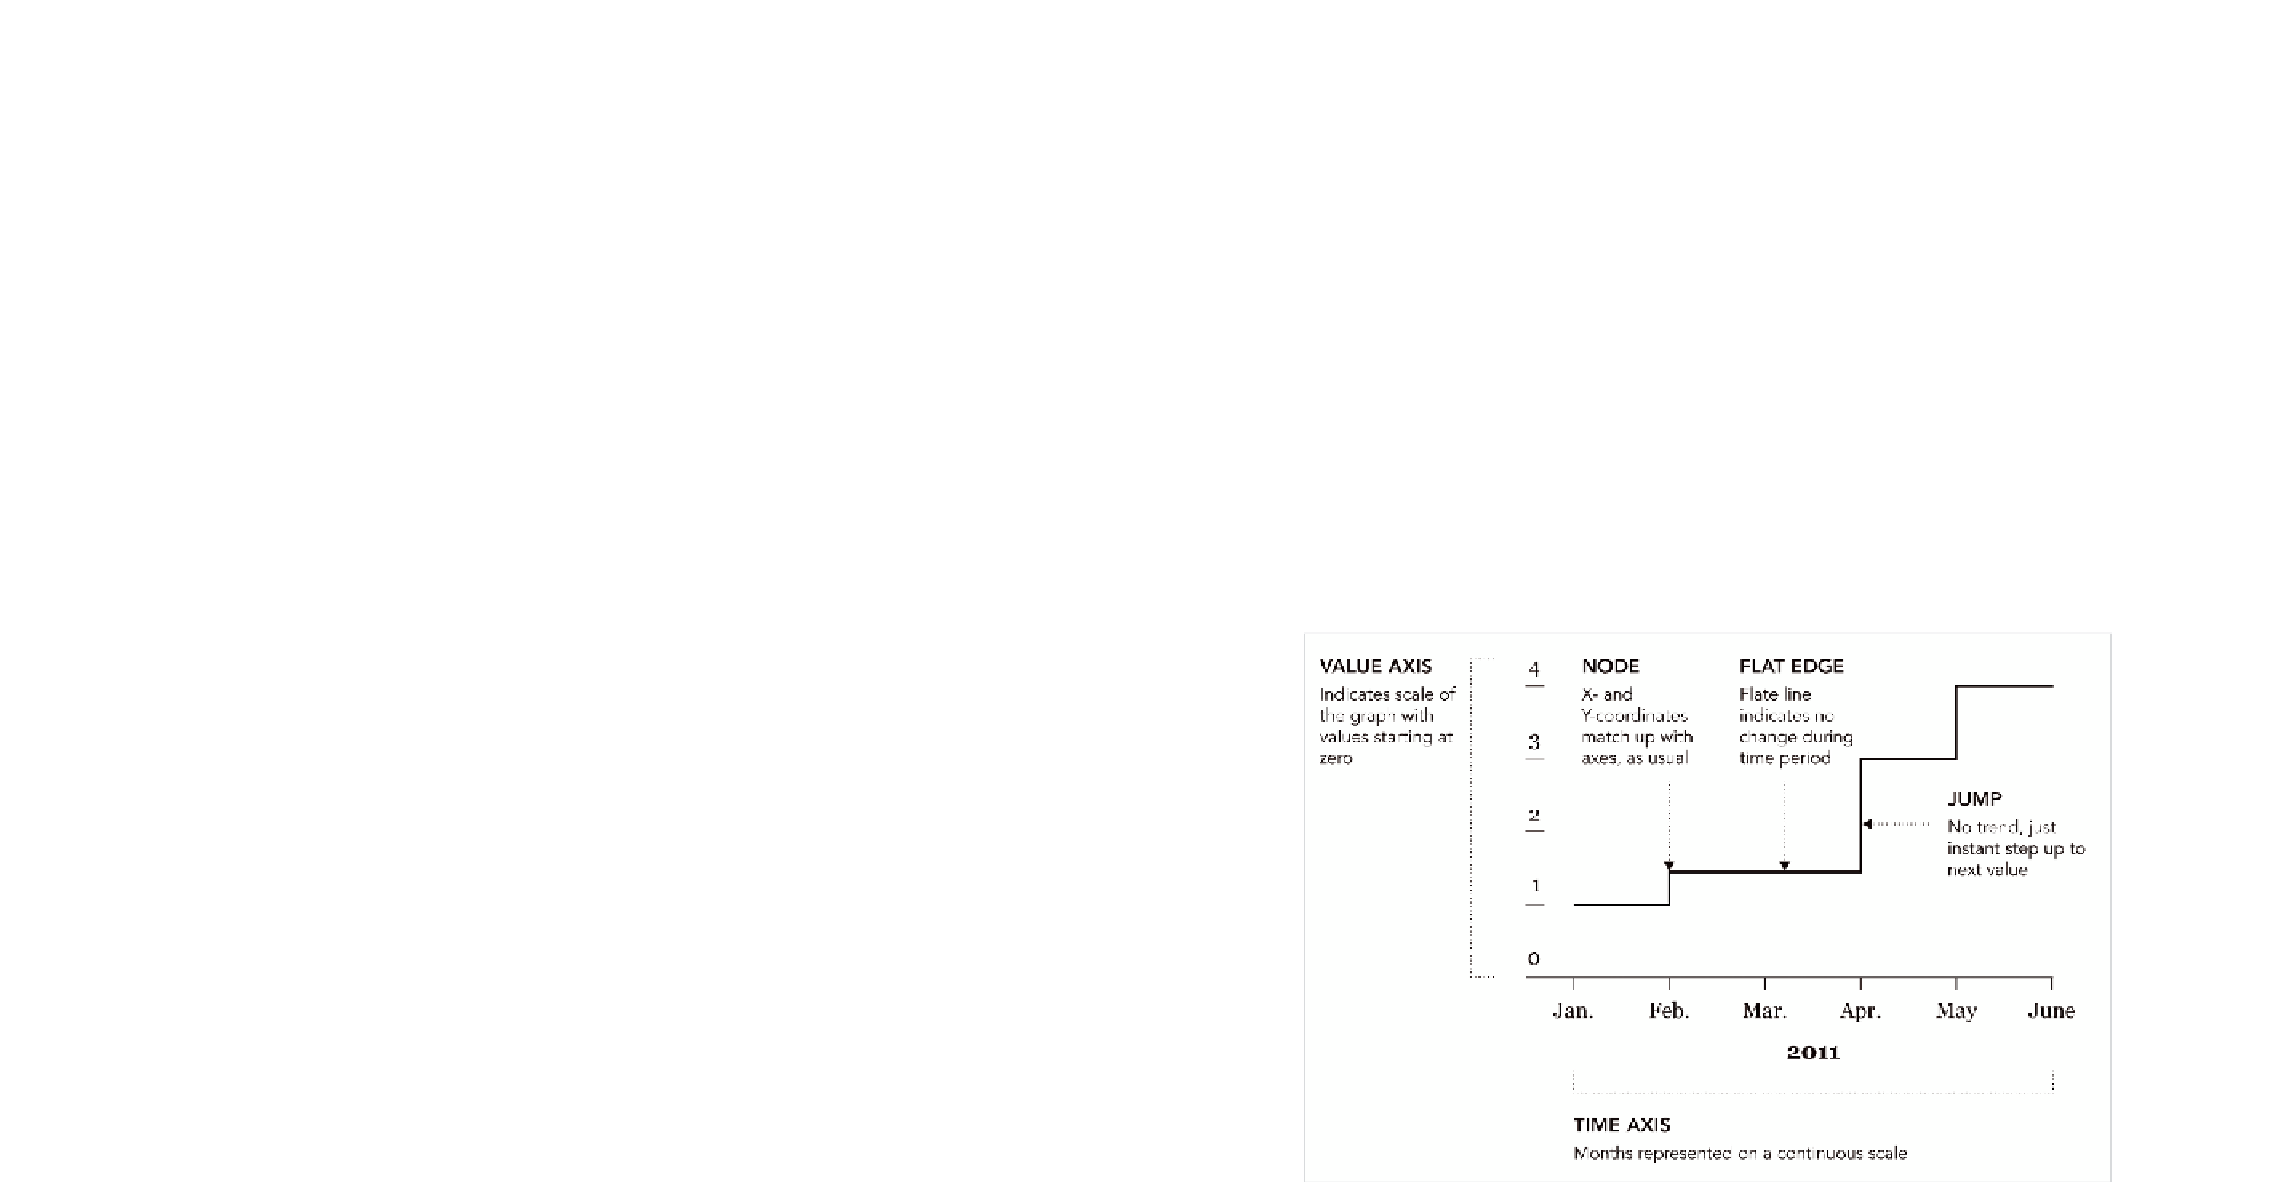
stay the same for months and then drop in a day. Use a step chart, as
shown in Figure 4-41, for this type of data.
Instead of connecting point A to point B directly, the line stays at the same
value until there is a change, at which point it jumps up (or down) to the
next value. You end up with a bunch of steps.
FIGurE 4-41
Step chart basic framework


Search WWH ::

Custom Search