Graphics Programs Reference
In-Depth Information
Here's your base, but you need to change some options so that the graph
doesn't look so rough. Right-click and select Type. Uncheck the box to
Mark Data Points to match Figure 4-39.
If you're going
to edit in Illustrator
and use a ba-
sic graph type,
save some time
and make the
graph directly in
Illustrator. You
don't need to make
everything in R
first. That said,
you don't have to
make everything in
Illustrator either.
Select Category Axis from the
drop-down menu, and choose
None for tick mark length.
Press OK. This can give you a
cleaner, less cluttered looking
graph. From here, follow the
same process that you fol-
lowed when you edited graphs
generated in R.
FIGurE 4-39
Graph options in Illustrator
You can clean up the vertical
axis, simplify the value labels,
add ticks and labels on the horizontal axis for years, and add a title and
some copy. You can also change the stroke style for the actual line so that
it stands out more. The default light gray makes it seem like the data is in
the background when it should be front and center. Make these changes,
and you should end up with Figure 4-40.
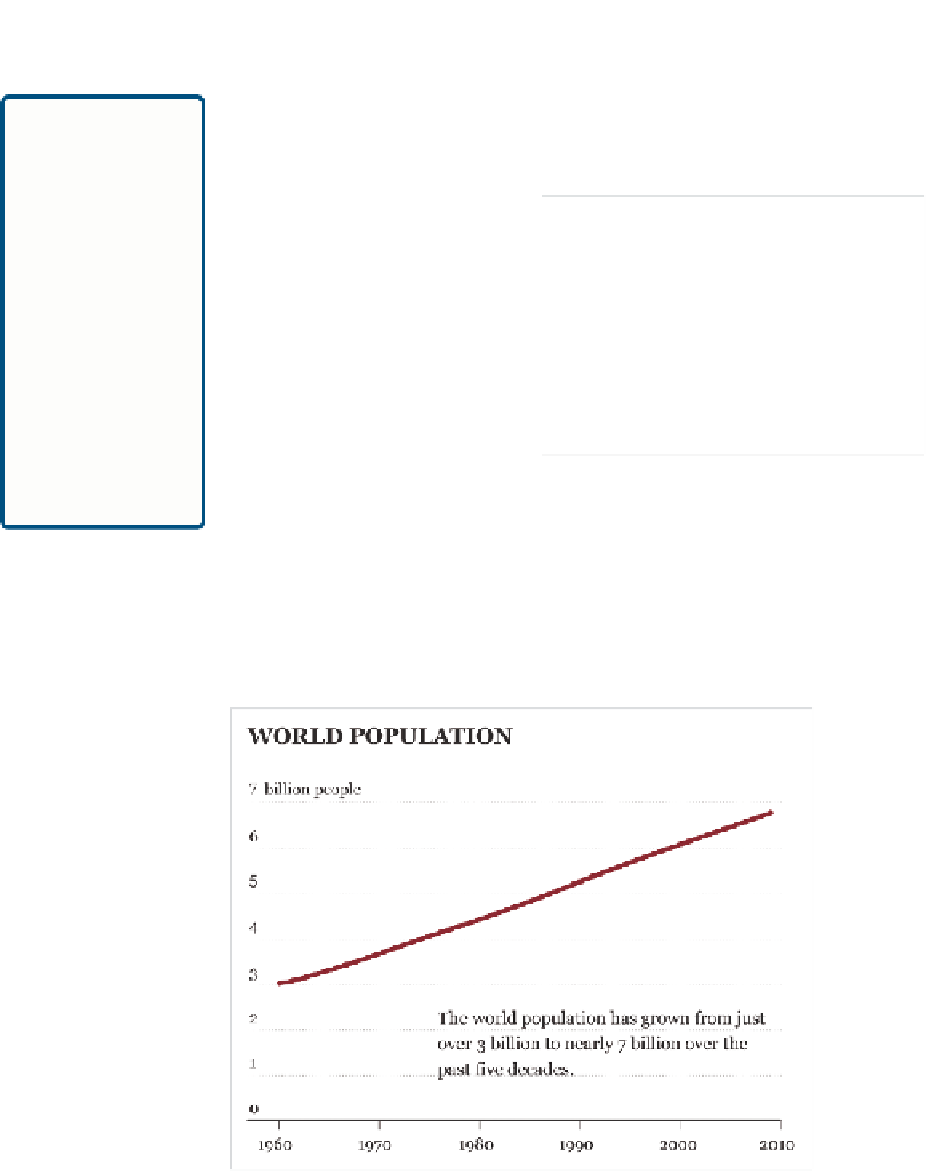
FIGurE 4-40
World population over the past five decades


Search WWH ::

Custom Search