Graphics Programs Reference
In-Depth Information
with
NA
, which is a logical constant meaning no value. You also labeled the
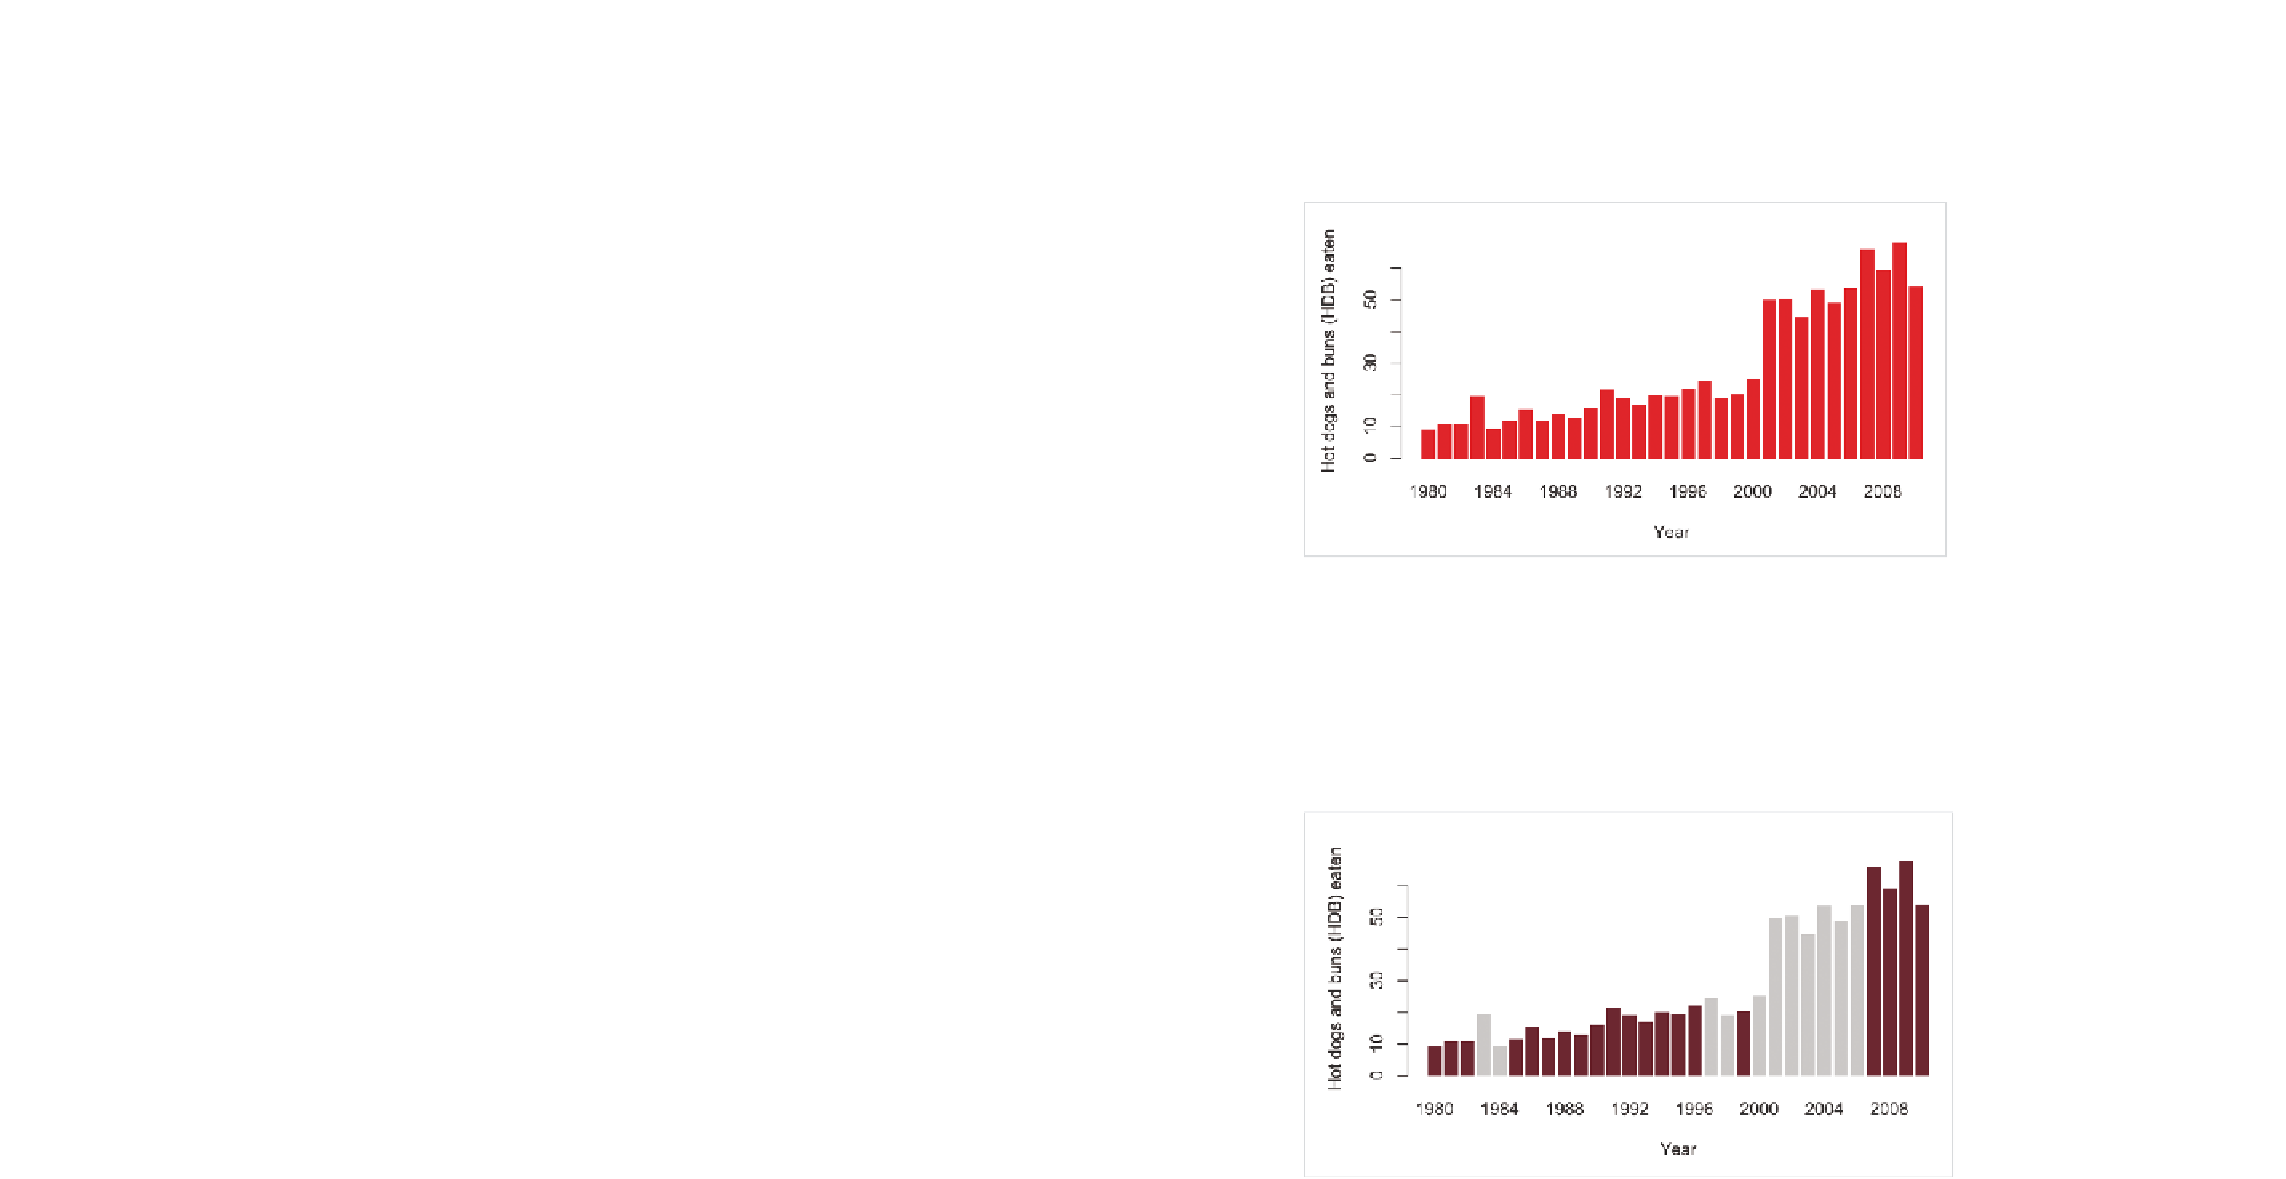
x- and y-axes as “Year” and “Hot dogs and buns (HDB) eaten,” respectively.
FIGurE 4-8
Bar graph with colored bars and labeled axes
You don't need to limit yourself to just one color. You can provide multiple
colors to
barplot()
to shade each bar how you want. For example, say you
want to highlight the years the United States won the contest. You can
highlight those years in dark red
(#821122
) and the rest a light gray, as
shown in Figure 4-9.
FIGurE 4-9
Bar graph with individually colored bars

Search WWH ::

Custom Search