Graphics Programs Reference
In-Depth Information
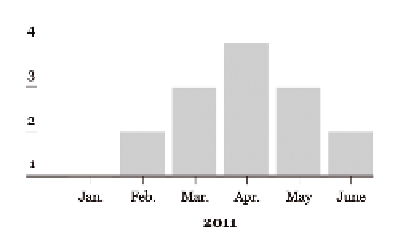
The value axis (the vertical one, that is, y-axis) indicates the scale of the
graph. Figure 4-3 shows a linear scale where units are evenly spaced across
the full axis. Bar height matches up with the value axis. The first bar, for
example, goes up to one unit, whereas the highest bar goes up to four units.
Always start the
value axis of your
bar graph at zero
when you're
dealing with all
positive values.
Anything else
makes it harder
to visually com-
pare the height
of the bars.
This is important. The visual cue for value is bar height. The lower the
value is, the shorter the bar will be. The greater a value is, the taller a bar
will be. So you can see that the height of the four-unit bar in April is twice
as tall as the two-unit bar in February.
Many programs, by default, set the lowest value of the value axis to the
minimum of the dataset, as shown in Figure 4-4. In this case, the mini-
mum is 1. However, if you were to start the value axis at 1, the height of the
February bar wouldn't be half the height of the April
bar anymore. It would look like February was one-
third that of April. The bar for January would also
be nonexistent. The point: Always start the value
axis at zero. Otherwise, your bar graph could dis-
play incorrect relationships.
CrEATE A bAr GrAPh
It's time to make your first graph, using real
data, and it's an important part of history that is
an absolute must for all people who call them-
selves a human. It's the results from the past
three decades of Nathan's Hot Dog eating Contest. Oh, yes.
FIGurE 4-4
Bar graph with non-zero axis
Figure 4-5 is the final graph you're after. Do this in two steps. First, create
a basic bar graph in R, and then you can refine that graph in Illustrator.
In case you're not in the know of the competitive eating circuit, Nathan's
Hot Dog eating Contest is an annual event that happens every July 4.
That's Independence Day in the United States. The event has become so
popular that it's even televised on eSPN.
Throughout the late 1990s, the winners ate 10 to 20 hot dogs and buns
(HDBs) in about 15 minutes. However, in 2001, Takeru Kobayashi, a profes-
sional eater from Japan, obliterated the competition by eating 50 HDBs.
That was more than twice the amount anyone in the world had eaten
before him. And this is where the story begins.


Search WWH ::

Custom Search