Biology Reference
In-Depth Information
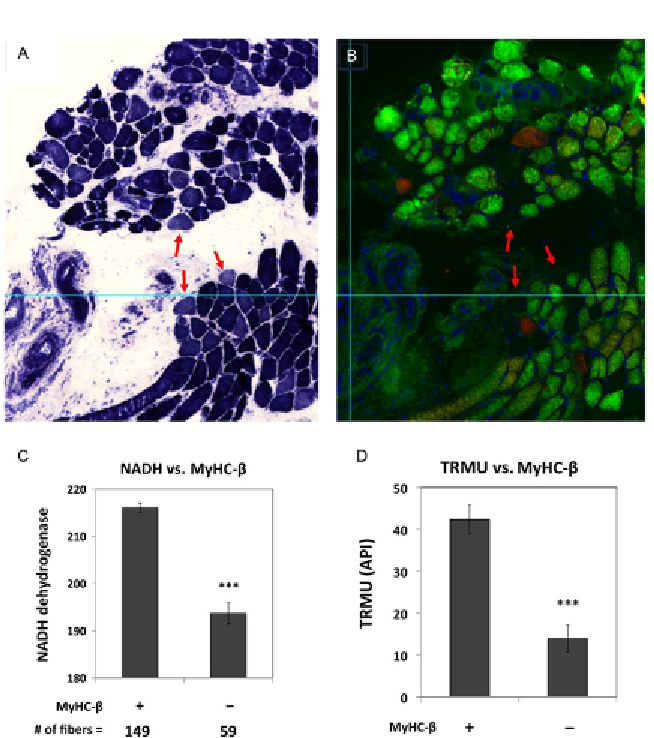
Figure 7.13 Quantification of NADH-dehydrogenase activity, MyHC-b expression, and
TRMU expression in human skeletal muscle. (A) A bright-field scan of human skeletal
muscle biopsy stained for NADH-dehydrogenase activity is shown. (B) The same biopsy
is shown, following labeling for biomarkers (visualized for TRMU and MyHC-b); the red
and green fluorescence channels are overlaid; red arrows point to examples of fibers
that are lightly stained for NADH dehydrogenase and are negative for TRMU and
MyHC-
. (C) The average intensity of NADH-dehydrogenase activity is shown for fibers
that are positive versus negative for MyHC-
b
expression. (D) The average label intensity
for TRMU expression is shown for fibers that are positive versus negative for MyHC-
b
b
expression.
***
p
<
0.001, Student
'
s
t
-test.
Search WWH ::

Custom Search