Biology Reference
In-Depth Information
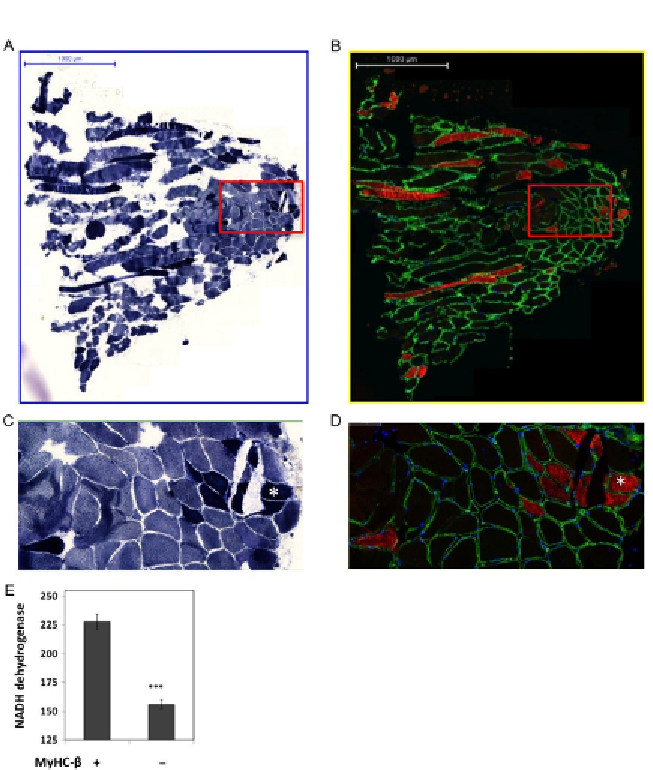
Figure 7.12 Correlation of NADH-dehydrogenase activity and MyHC-b expression in
human skeletal muscle. (A) A bright-field image is shown obtained from a human skel-
etal muscle biopsy (from the vastus lateralis muscle), labeled for NADH-dehydrogenase
activity utilizing colorimetric reagents. (B) The same biopsy is shown, labeled for laminin,
and MyHC-b (a biomarker for Type I fibers) in the green and red fluorescence channels,
respectively. A portion of the biopsy is shown at higher magnification visualized by
bright field or fluorescence in (C) and (D); a fiber that is positive for both NADH-
dehydrogenase activity and MyHC-b is denoted with an asterisk. (E) The relationship
between MyHC-b expression (fibers that displayed red fluorescence label) and
NADH-dehydrogenase activity (intensity of the colorimetric stain) is shown; each bar
represents the meanSE for n¼4 fibers (MyHC-b positive) or n¼31 fibers (MyHC-b
negative), respectively.
***
p
<
0.001, by Student's t-test.
Search WWH ::

Custom Search