Biology Reference
In-Depth Information
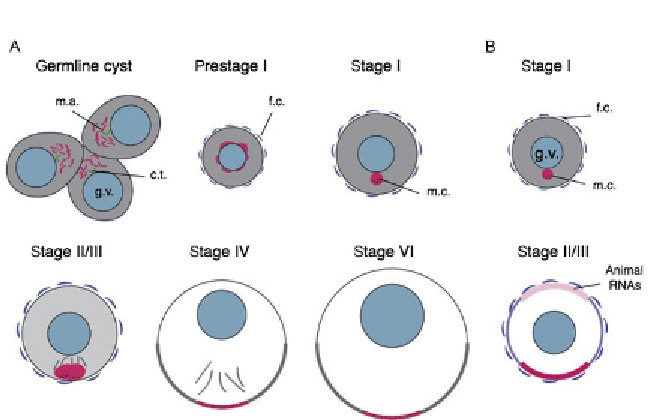
Figure 4.3 Stages of oogenesis and RNA localization patterns in frogs and fish. (A) Dia-
gram of oogenesis in Xenopus. Stages are indicated above each panel. Red color indi-
cates mitochondria and germ plasm-localized RNAs, gray indicates the pattern of late
pathway RNAs, and black dots indicate germinal granules. (B) Diagram of oogenesis in
zebrafish. Color coding is similar to (A), except that animal pole-localizing RNAs are
shown in pink, and cortically localizing RNAs are shown in purple. m.a., mitochondrial
aggregate; c.t., centrosomes; f.c., follicle cells; m.c., mitochondrial cloud.
domains of expression within the vegetal cortex (
Forristall et al., 1995; Kloc
and Etkin, 1995
;
Figs. 4.3 and 4.4
).
One set of RNAs, including
nos1
(
xcat2
) and
xlsirts
, localized to the mito-
chondrial cloud/Balbiani body early in oogenesis and followed the general
localization of the germ plasm. This pathway was termed the “early path-
way” (also the METRO, messenger transport organizer;
Kloc and Etkin,
1995
). Another set of RNAs, such as
gdf1
and
vegt
, did not localize to the
mitochondrial cloud and localized to the broader vegetal cortex later in
oogenesis, thus becoming the “late pathway.” It was initially speculated
that the early pathway RNAs would function in germline specification,
whereas the late pathway ones would act in regulating somatic cell fates
(
Forristall et al., 1995; Kloc and Etkin, 1995
). Maternal mRNA depletion
experiments have generally borne out of these predictions (
Houston and
King, 2000a; Zhang et al., 1998
), although recent experiments suggest that
some germ plasmRNAs have roles in dorsal axis formation (see
Section 4.3
).
Search WWH ::

Custom Search