Graphics Programs Reference
In-Depth Information
2
1
Image tones and histogram shapes
:
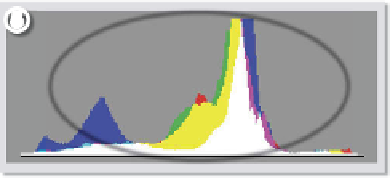
The histogram in ACR shows the distribution of
pixels across the image. Areas with the most pixels
are the tallest areas of the graph. The shape of the
histogram indicates the look of the picture.
1. An overexposed image has a histogram with the
pixels bunched to the right end of the graph.
2. Conversely, underexposed photos have pixels
pushed to the left.
3. Flat or low-contrast pictures typically have all
their pixels grouped in the middle.
4. High-contrast photos or those that have 'clipped'
highlights and shadow areas usually have many
pixels at the extreme ends of the graph.
5. For the best results, with most images, you
should always aim to spread the pixels between
the maximum black and white points without
clipping any of the image pixels.
This is not the case for all photos. Take, for
instance, the case of a black cat in a darkened
room. The correct histogram for this photo will
show a bunching of the pixels towards the left
side of central. Whereas a shot of the ski
slopes,however, also correctly exposed, will
display most pixels to the right of the histogram
graph.
3
4
5
HISTOGRAMS
To activate the highlight and shadow clipping warnings you
click onto the upward-facing arrows in the top left or right
corners of the histogram. The feature is active when the box
surround is white. The warning is off when the box is outlined
in dark gray.
Histograms display a
graph of all the pixels
in your image. The lef t-
hand side represents
the black values, the
right the white end of
the spectrum and the
center section the
midtone values.
In a 24 -bit image (8 bits
per channel) there are
a total of 256 levels of
tone possible from
black to white - each of
these values is repre-
sented on the graph.
The number of pixels in
the image with a par-
ticular brightness or
tonal value is displayed
on the graph by height.
The higher the spike at
any point the more pix-
els of this value are
present in the picture.
Active
Not-Active
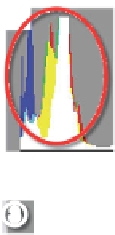
RGB readout and camera
settings summary
There is a two-part information panel
beneath the histogram. The left hand
side contains a RGB (Red, Green, Blue)
readout for the pixels beneath the mouse cursor. An 8 bits per channel scale with values
between 0 (black) and 255 (white) is displayed (1).
1
2
On the right hand side is a summary of the camera settings used to capture the image. The
values displayed include aperture (f-stop), shutter speed, ISO and focal length (2).


Search WWH ::

Custom Search