Information Technology Reference
In-Depth Information
nm
∑∑
logL(Θ r)=
{logα +logψ (r θ )}
(5)
j
j
i
j
i=1
j=1
3 Case Study and Test
The flight operation data used in this case study was provided by a domestic airline.
Information like arrival delay, upstream delay propagation and delay rate was ex-
tracted from the experimental data which was also divided into several groups catego-
rized by operating date, test set (only one set), and training set (excepting the test set).
Parameters were estimated in the genetic EM algorithm on the training set. The fit-
ness of the model was validated on the test set.
3.1 Density Estimation of Delay Rate
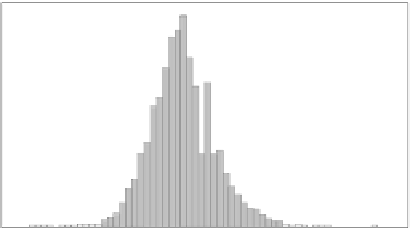
Density estimation of delay rate was implemented in Matlab7.1. In Fig. 1, the distri-
bution represents a mixture of normal distributions rather than a single normal distri-
bution. Assuming component number m=1,2,3,4, we obtained one single model and
three mixture models after parameter estimation. As a result, Fig. 2 shows a fitted
distribution with two components.
0.1
0.08
0.06
0.04
0.02
0
-0.6 -0.4
-0.2
0
0.2 0.4 0.6
Rate
Fig. 2.
Fitted Distribution with Two Components
3.2 Fitness Test of the Model
Since the normal mixture models from above are mixtures of normal distributions,
general test methods cannot be directly applied to fitness test for the model. There-
fore, a probability interval based test was used with steps shown as following:
Step1. Find a interval [p
1
,p
2
] to contain P% of the values from a normal
distribution;
Step2. Compute the inverse of the normal cumulative distribution function with
parameters
i
and
∑
i
at the corresponding probabilities: [a
i
,b
i
]=norminv
μ
([p
1
,p
2
],
μ
i
,∑
i
);


Search WWH ::

Custom Search