Information Technology Reference
In-Depth Information
10
0
10
-1
10
-2
Init ial N=6 4
the mixed N=64
Init ial N=2 56
the mixed N=256
Init ial N=5 12
the mixed N=512
Init ial N=1 024
the mix
e
d N=1024
10
-3
10
-4
10
-5
2
4
6
8
10
12
14
PAPR(dB)
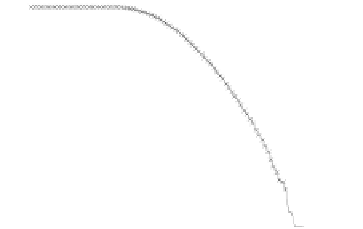
Fig. 8.
Comparison of PAPR performance with different subcarriers
10
0
10
-1
10
-2
10
-3
-4
10
LCT
TCM
m ix e d a lgo r it h m
10
-5
10
-6
0
2
4
6
8
10
12
14
16
SN R
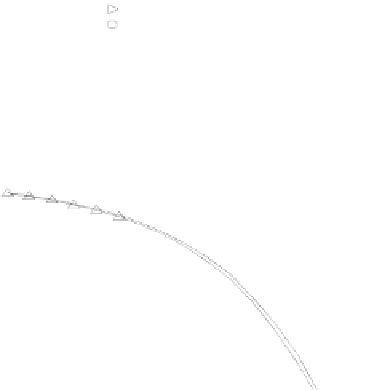
Fig. 9.
Comparison of BER performance
4.5 The Number of the Subcarriers Comparison
Considering different number of subcarriers, the performance of hybrid algorithm is
shown in Fig. 8, which shows the different performance of the system using hybrid
algorithm when the number of subcarriers is 64, 256, 512 and 1024 for
L
=
, respec-
tively. It can be seen from the figure in different number of subcarriers PAPR of OFDM
signals can obviously be reduced. When we consider 1024 subcarriers and
3
16
−
, the threshold of the hybrid algorithm signal is 7.4dB lower than the
conventional OFDM signal. But the difference of PAPR performance is small when the
number of subcarriers is different. It can be shown that the choice of the number of
subcarriers has little effect on the PAPR values, and hybrid algorithm can be applied to
any number of subcarriers.
CCDF
=
10
4.6 BER Comparison
We assume that signal modulation is QPSK and the subcarriers are 64. 100000 ran-
domly symbols are generated with Gaussian noise channel (AWGN). From the Figure
9, it is demonstrated that BER of the hybrid algorithm is close to the BER of TCM
algorithm and LCT algorithm.


Search WWH ::

Custom Search