Information Technology Reference
In-Depth Information
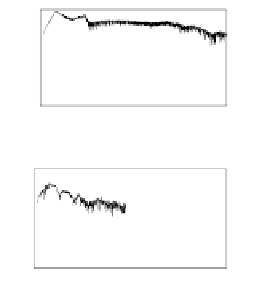
WT-CC and WT-TC. A group of power spectrum density (PSD) of measured signal at
the sound path of
h
=0.5m,
l
=1.8m is shown in Figure 2.
x
1
(
n
) and
x
2
(
n
) are measured
signal of MIC1 and MIC3.
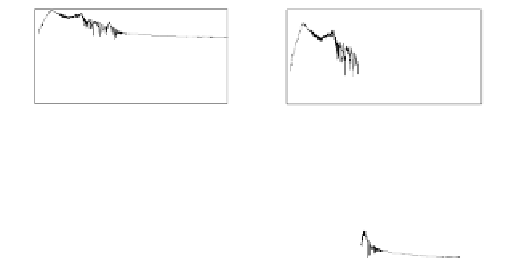
From Figure 2, it can be seen that, sound signal is obviously attenuated after
propagating for a distance, and the higher the frequency is, the more sound signal
attenuated; after wavelet transform de-noise, the signal its frequency higher than
1500Hz is attenuated about 20dB, and its PSD curve becomes smooth, but the signal
its frequency lower than 1500Hz is not attenuated;
y
1
(
m
) and
y
2
(
m
) are both attenuated
70dB based on de-noise signal
x
′
1
(
n
) and
x
′
2
(
n
) as the frequency higher than 1500Hz,
nevertheless, only 20~30dB attenuation as the frequency lower than 1500Hz.
20
20
20
-20
-20
-20
-60
-60
-60
-100
-100
-100
-140
-140
-140
0
1
2
3
4
5
1
2
3
4
5
0
1
2
3
4
5
0
f/
kHz
f/
kHz
f/
kHz
(b) PSD of de-noise signal
x
′
1
(
n
)
(c) PSD of signal
y
1
(
m
)
(a) PSD of signal
x
1
(
n
)
20
20
20
-20
-20
-20
-60
-60
-60
-100
-100
-100
-140
-140
-140
0
1
2
3
4
5
1
2
3
4
5
0
0
1
2
3
4
5
f/
kHz
f/
kHz
f/
kHz
(d) PSD of signal
x
2
(
n
)
(e) PSD of de-noise signal
x
′
2
(
n
)
(
f) PSD of signal
y
2
(
m
)
Fig. 2.
PSD of measured signals
As the temperature of soybeans is
T
1
=300K and
T
2
=291K respectively, three sound
travel-time estimation methods wer
e
used
to
measure sound travel-time of six sound
paths in stored grain for 100 times.
t
and
t
are the average values of measured data
at different temperature of stored grain. The stability and accuracy of sound
travel-time measurement in stored grain are evaluated by follow
tt
/
−
TT
/
s
s
21
1 2
v
=×
1
100% ,
v
= ×
2
100% ,
r
=
×
100% .
(10)
1
2
e
t
t
TT
/
1
2
1
2
where
s
1
and
s
2
are the standard deviation of
t
and
t
;
v
1
and
v
2
are the coefficient
of variance of
t
and
t
;
r
e
is the relatively error of the ratio of sound travel-time at
different temperature in stored grain.
Shown in Table 1,
v
1
and
v
2
of WT-TC are much smaller than the other two
methods. The maximum of
r
e
of WT-TC, WT-CC and CC are 0.16%, 0.35% and
0.64% respectively. Therefore, the stability and accuracy of WT-TC are better than
the other methods.


Search WWH ::

Custom Search