Database Reference
In-Depth Information
you have an especially expensive stage, you can click through and better understand
what user code the stage is associated with.
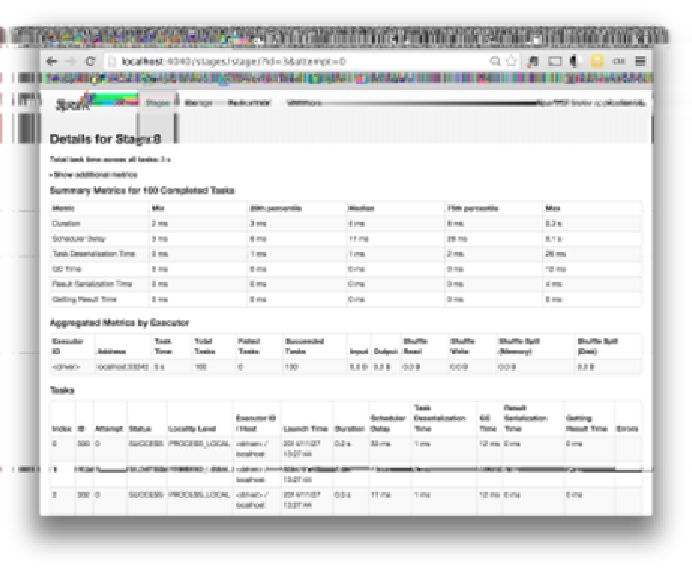
Once you've narrowed down a stage of interest, the stage page, shown in
Figure 8-3
,
can help isolate performance issues. In data-parallel systems such as Spark, a com‐
mon source of performance issues is
skew
, which occurs when a small number of
tasks take a very large amount of time compared to others. The stage page can help
you identify skew by looking at the distribution of different metrics over all tasks. A
good starting point is the runtime of the task; do a few tasks take much more time
than others? If this is the case, you can dig deeper and see what is causing the tasks to
be slow. Do a small number of tasks read or write much more data than others? Are
tasks running on certain nodes very slow? These are useful first steps when you're
debugging a job.
Figure 8-3. The Spark application UI's stage detail page
In addition to looking at task skew, it can be helpful to identify how much time tasks
are spending in each of the phases of the task lifecycle: reading, computing, and writ‐
ing. If tasks spend very little time reading or writing data, but take a long time overall,
it might be the case that the user code itself is expensive (for an example of user code