Geology Reference
In-Depth Information
35
20
30
Str
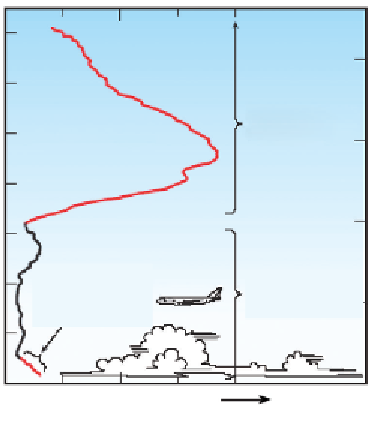
atosphe
ric
Ozone
25
Ozone Layer
15
20
10
15
Ozone
increases
from pollution
10
Tropospheric
Ozone
5
5
0
Ozone concentration
Figure 6 A typical atmospheric ozone profile through the atmosphere.
58
The concentra-
tion is expressed as a volume mixing ratio
contribution of both chemistry and transport to the tropospheric ozone
budget on many different spatial and temporal scales.
There is growing evidence that the composition of the troposphere is
changing.
11
For example, analysis of historical ozone records has indi-
cated that tropospheric ozone levels in both hemispheres have increased
by a factor of 3-4 over the last century. Methane concentrations have
effectively doubled over the past 150 years and N
2
O levels have risen by
15% since pre-industrial times.
12
Measurements of halocarbons have
shown that this group of chemically and radiatively important gases to
be increasing in concentration until relatively recently.
12
One of the difficulties about discussing tropospheric chemistry in
general terms is that by the very nature of the troposphere being the
lowest layer of the atmosphere it has complex multi-phase interactions
with the earth's surface, which can vary considerably between expanses
of ocean to deserts (see Figure 7). The fate of any chemical species (C
i
)in
the atmosphere can be represented as a continuity or mass balance
equation such as
dC
i
dt
¼
duC
i
dx
dvC
i
dy
dwC
i
þ
K
z
dC
i
dz
þ
P
i
L
i
þ
S
i
dz
dC
i
dt
þ
ð
2
:
6
Þ
clouds