Geology Reference
In-Depth Information
9.E-03
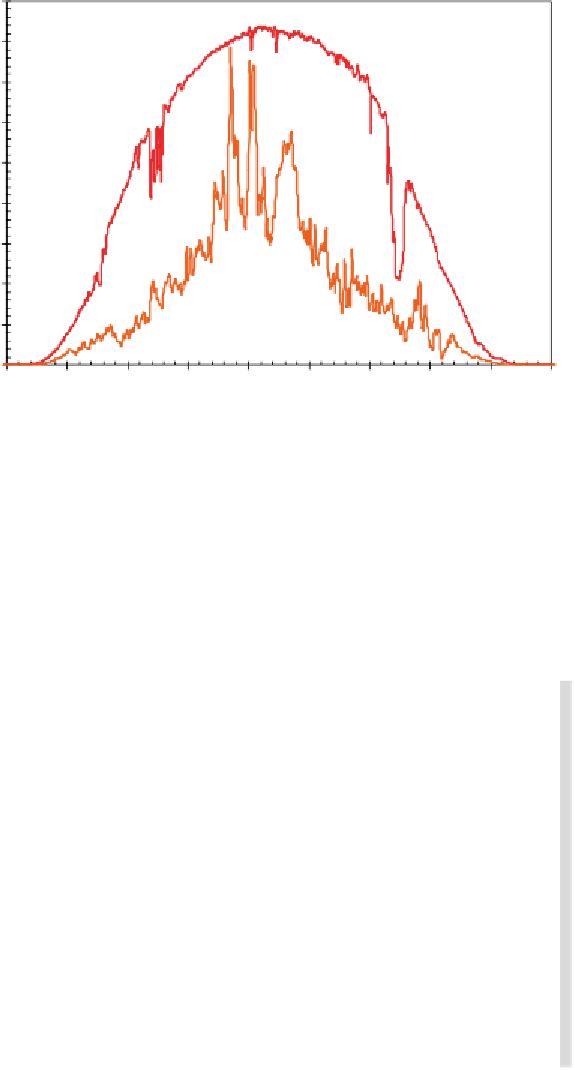
J214 (clear)
J224 (cloudy)
8.E-03
7.E-03
6.E-03
5.E-03
4.E-03
3.E-03
2.E-03
1.E-03
0.E+00
04:00
06:00
08:00
10:00
12:00
14:00
16:00
18:00
20:00
22:00
time (UT)/ h
Figure 5 Diurnal profile of j(NO
2
) (reaction (2.2)) measured on a clear sky and cloudy
day
61
where s the absorption cross-section (cm
2
), f the quantum yield of the
photoproducts and T the temperature. Figure 5 shows a typical meas-
ured photolysis rate for NO
2
(reaction (2.2)) in the atmosphere. The
photolysis rate reaches a maximum at solar noon concomitant with the
maximum in solar radiation.
Example for the calculation of photolysis rates
From the following data calculate the photolysis rate of O
3
into
O(
1
D) at T
¼
298 K.
Wavelength (nm) F(l) (photon cm
2
s
1
) s (cm
2
molec
1
)
f
2.66
10
13
59.95
10
20
295-300
1.0
4.20
10
14
26.50
10
20
300-305
1.0
1.04
10
15
15.65
10
20
305-310
0.83
1.77
10
15
7.95
10
20
310-315
0.26
4.15
10
20
1.89
10
15
315-320
0.21
The data used represent a gross approximation, owing to the large
changes in all the quantities in the region of the atmospheric cut-off, but