Geology Reference
In-Depth Information
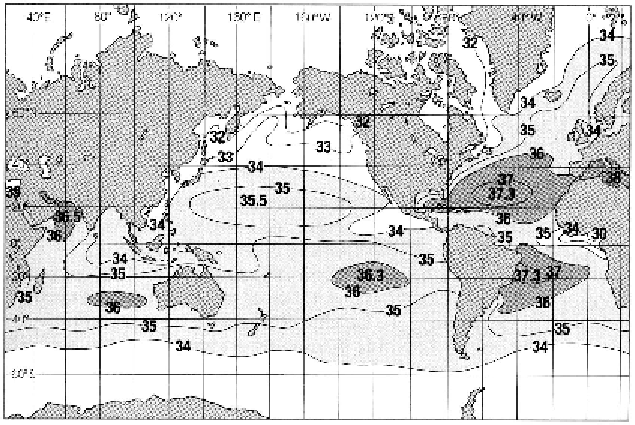
Figure 3 The distribution of mean annual salinity in the surface waters of the ocean
(Adapted from The Open University, 1989.
3
)
In a plot of temperature against salinity (a T-S diagram), constant s
t
appear as curved lines, which denote waters of constant pressure and are
known as isopycnals. A zone in which the pressure changes greatly is
known as a pycnocline. Within the water column, a pycnocline, there-
fore, separates water with distinctive temperature and salinity charac-
teristics, usually indicative of different origins. A T-S diagram can also
be used to estimate the properties resulting from the mixing of two water
masses. As noted above, the temperature is not a conservative property,
and therefore s
t
is also non-conservative. To circumvent the associated
difficulties of interpretation, an analogous term known as the potential
density, s
y
, is defined on the basis of potential temperature instead of in
situ temperature. The s
y
is therefore a conservative index.
4.1.3 Salinity Concepts
Salinity is a measure of the salt content of seawater. Developments in
analytical chemistry have led to an historical evolution of the salinity
concept. Intrinsically, it would seem to be a relatively straightforward
task to measure. This is true for imprecise determinations that can be
quickly performed using a hand-held refractometer. The salinity affects
seawater density and thus, the impetus for high precision in salinity
measurements came from physical oceanographers.

