Geoscience Reference
In-Depth Information
1.0
(a)
0.8
0.6
0.4
0.2
0.0
0
200
400
600
800
1000
Solar Radiation (W m
−
2
)
1.0
(b)
0.8
0.6
0.4
0.2
0.0
0
1
2
VPD (k Pa)
3
4
1.0
(c)
0.8
0.6
0.4
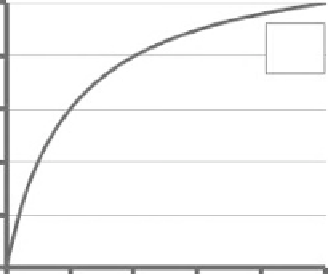
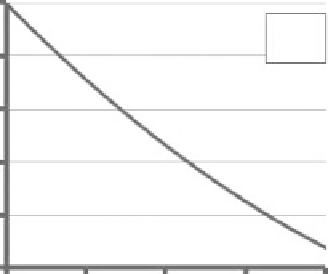
Figure 26.15
Variation in
stomatal conductance stress
factor associated with
(a) radiation, (b) vapor pressure
deficit, and (c) temperature
calculated in question 9(g).
0.2
0.0
0
5
10
15
Temperature (
20
25
30
35
40
C)
aerodynamic resistance as the height and roughness of the vegetation
stands increase.
(g) The required plots of
g
R
, g
D,
and
g
T
are given in Fig. 26.15.
(h) The required plots of
g
R
, g
D
,
and
g
T
and the total stress function (
g
R
g
D
g
T
g
M
,
)
through the day are given in Fig. 26.16.
(i) The required plots of available energy, latent heat and sensible heat fluxes
are given in Fig. 26.17.