Geoscience Reference
In-Depth Information
Latent Heat Flux
Precipitation
(W m
−
2
)
(mm d
−
1
)
4
60
3
40
June
June
2
30
1
20
0.5
10
−
0.5
−
10
−
1
−
20
July
July
−
2
−
30
−
3
−
40
−
4
−
60
August
August
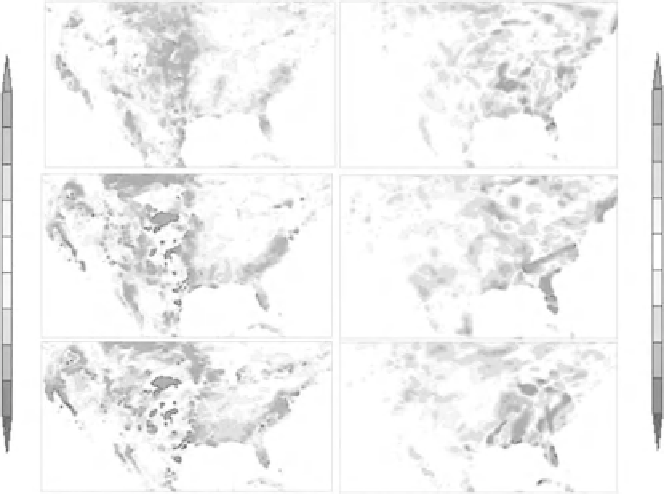
Figure 25.5
Map of differences in monthly average latent heat flux (W m
-2
) and precipitation (mm d
-1
) given when a
description of interactive vegetation cover was introduced into the Weather Research and Forecasting (WRF) model
coupled with the Noah land surface model to substitute for prescribed changes in vegetation cover. The modeled domain
covers the contiguous US between 21°N-50°N and 125°W-68°W. (Redrawn from Jiang
et al.
, 2009, published with
permission.) See Plate 9 for a colour version of this image.
the last few decades there has been major research investment in developing
interactive vegetation models for inclusion in GCMs. Progress has been good and
classification of the quantification and modeling of this mechanism is currently
assessed as being of 'medium' quality in Table 25.1. Validation of such models is
a research priority, and when the predictive performance of such interactive
vegetation models has been fully validated (perhaps against remote sensing data)
this assessment will become 'good.
3.
Effect of transient changes in frozen precipitation cover
There are several physically plausible ways in which changes in frozen precipitation
cover can alter surface energy exchanges and through this modify weather and
climate. For example, the seasonal presence of snow and ice on the ground
generally causes an associated marked change in albedo and radiant energy cap-
ture (see Chapter 5), and the magnitude of this change varies both with time and
with the nature of the vegetation covering the ground. Also, while soils are still
frozen plants cannot extract water from the soil, so there is a resulting inhibition
on transpiration until the soil water melts, and this inhibition may persist into