Geoscience Reference
In-Depth Information
110 W
106 W
0.40
0-500
500-1000
1000-1500
1500-2000
2000-2500
2500-3000
Network mean
30
00
N
(c)
(a)
0.35
0.30
28 N
28
00
N
0.25
0.20
26
00
N
0.15
0.10
24
00
N
24 N
0.05
0.00
02468 0
Time of day (LST)
12
14
16
18
20
22
24
10.0
0-500
9.0
(d)
110 W
106 W
500-1000
1000-1500
1500-2000
2000-2500
2500-3000
Network mean
8.0
7.0
30
00
N
(b)
6.0
28 N
28
00
N
5.0
4.0
26
00
N
3.0
2.0
24 N
24
00
N
1.0
0.0
4
6
14
16
0
2
8 0
Time of day (LST)
12
18
20
22
24
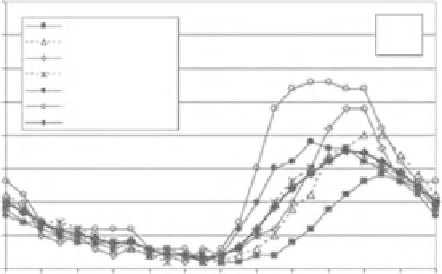
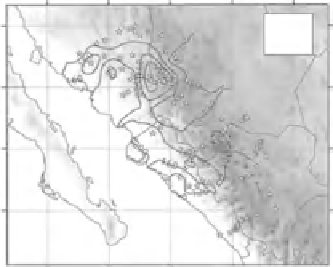
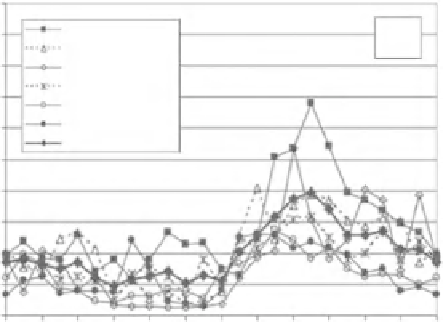
Figure 25.2
Contours of total precipitation for (a) Aug 2002 and (b) July and Aug 2003 with contour interval 40 mm
derived from the transects of rain gauges located at the positions shown by stars along transects across the Sierra Madre
Mountain Range. Diumal cycles of (c) hourly precipitation frequency and (d) hourly precipitation intensity derived from
these rain gauges separated into elevation-band averages. (Redrawn from Gochis
et al.
, 2004, published with permission.)
generate hydrological flows remains poorly understood and modeled. Redressing
this shortcoming remains a major challenge for terrestrial hydrometeorology.
Because the physical basis for an influence of topography on weather and
climate is plausible and there is much evidence of its existence in climate records
and from experiments and models, the credibility of this mechanism providing
a means for land surfaces to affect climate and weather is assessed as being
'extremely likely' in Table 25.1. Quantification and modeling of the mechanism is
assessed as being of 'medium' quality for long-term time averages but is assessed
as still 'poor' at short time scales. There is a clear need for more research in this
last area.