Geoscience Reference
In-Depth Information
Vegetation
dynamics
Vegetation
growth cycle
CO
2
S
L
d
N
2
P
Lu
l
E
L
u
H
L
u
L
u
S
r
l
E
H
l
E
l
E
S
r
H
H
S
r
S
r
l
E
H
S
r
Bare soil
Snow pack
Runoff
Runoff
Runoff
Runoff
Deep drainage
Deep drainage
Deep drainage
Deep drainage
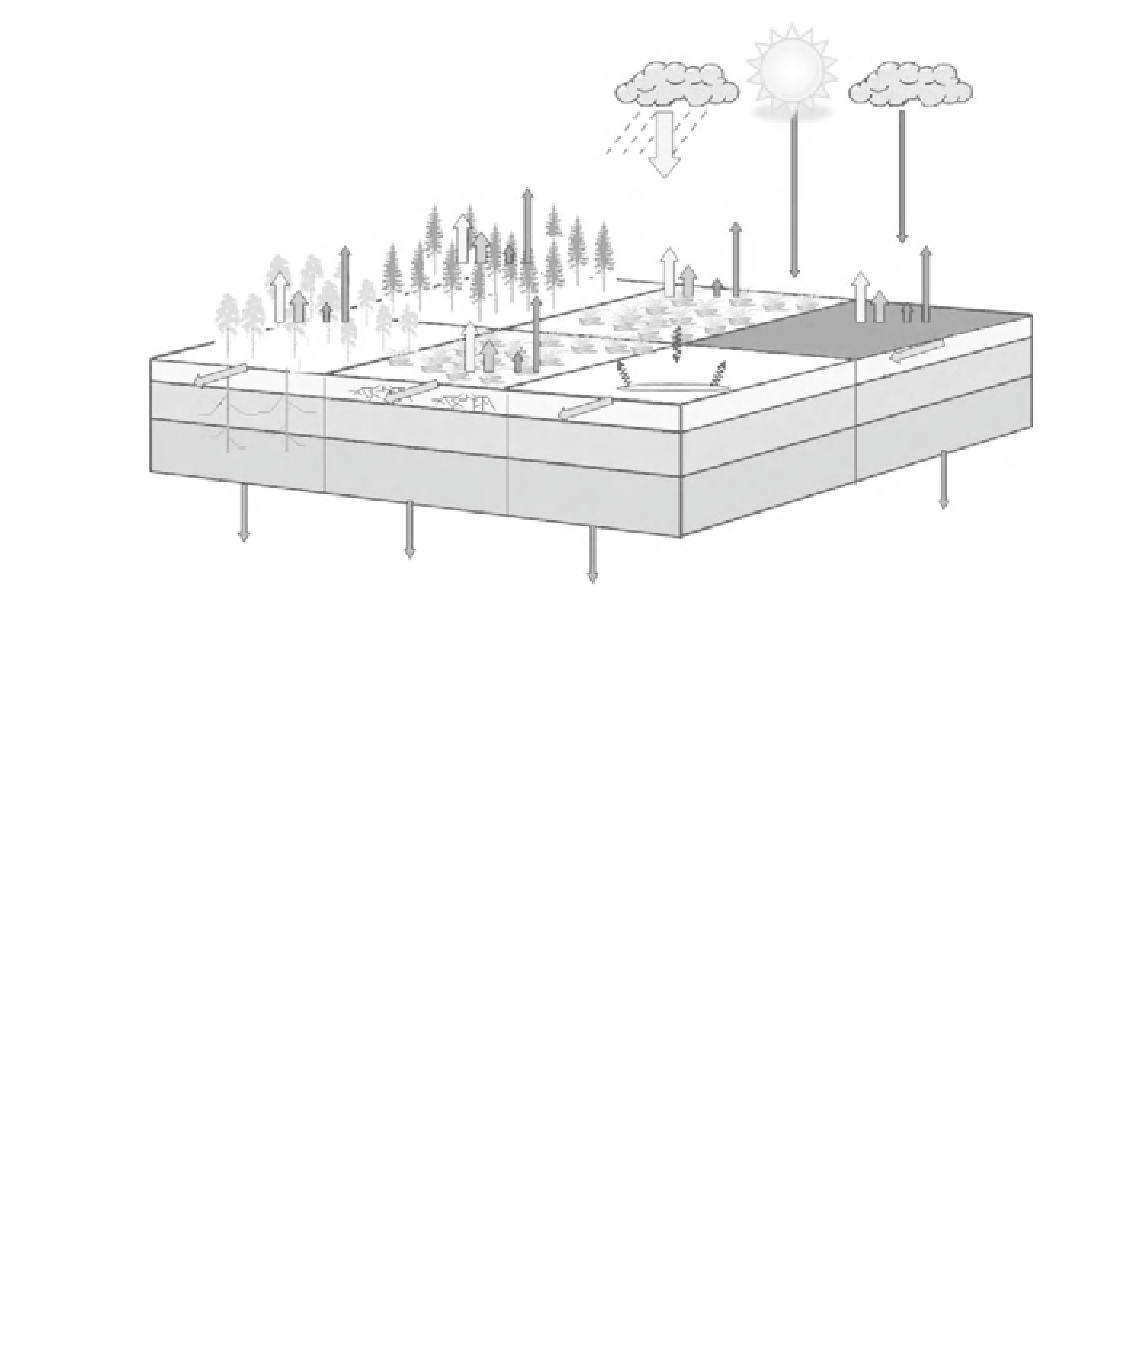
Figure 24.7
Schematic diagram of SVATS with improved representation of vegetation related processes, including CO
2
exchange and ecosystem evolution. See Plate 5 for a colour version of this image.
numerically equal to the relative humidity, but which in some SVATS (e.g.,
Dickinson
et al.
, 1998), is assumed to be a function of vapor-pressure deficit. The
introduction of this alternative means of describing the behavior of stomata has
sometimes been referred to as the 'greening of SVATS. In this formula, the simplest
estimate of
A
n
, is given (Farquhar and Sharkey, 1982) by:
(24.8)
A
=
min(
J
,
J
,
J
)
n
c
e
s
where
J
c
, J
e
, J
s
are functions expressing the assimilation rates when limited by the
Rubisco enzyme, light, and transport capacity, respectively, for C3 and C4 plants;
see Collatz
et al.
(1991; 1992), Sellers
et al.
(1996) and Cox
et al.
(2001). In practice,
it has been observed that the transition between these three limiting rates is not
abrupt but gradual, and some SVATS (e.g., Collatz
et al.
, 1991; Cox
et al.
, 2001)
have devised mathematical ways to simulate this smooth transition.
Thus, a key difference between the Ball-Berry formula for stomatal conductance
(resistance) and the Jarvis-Stewart formula is that stress factors (apart from that
for humidity) are no longer combined as a product; rather, one factor is considered
to be the dominant limitation on carbon assimilation and hence on stomatal
conductance. SVATS continue to make progress in describing vegetation and are