Geoscience Reference
In-Depth Information
more difficult it is to entrain air downward through it, and vice versa.
Entrainment also increases when the surface sensible heat flux (strictly the
surface buoyancy flux) increases because the intermittent breakdowns in the
inversion layer are related to the strength of turbulence in the ABL. For a given
strength of stable inversion, feedback processes can come into play to moderate
the VPD in the ABL. If, for example, the VPD tended to increase, then (assuming
the surface resistance and the available energy do not alter) surface evaporation
will increase and surface sensible heat flux (and also entrainment of drier air)
will decrease. The net result is, therefore, to counteract the increase in VPD. The
converse is true if VPD decreases. Because the ABL grows beneath a partially
contained inversion layer during the day when most evaporation occurs, and
because surface-atmosphere feedback constrains the magnitude of the VPD in
the ABL, natural evaporation rates are restricted to being about 25% greater
than the equilibrium evaporation rate. This applies in moderate humid
atmospheres when the surface resistance is reasonably small and is the reason
why hydrologists and meteorologists have been able to postulate the hypothetical
existence of potential rates of evaporation, a point discussed further below and
in Chapter 23.
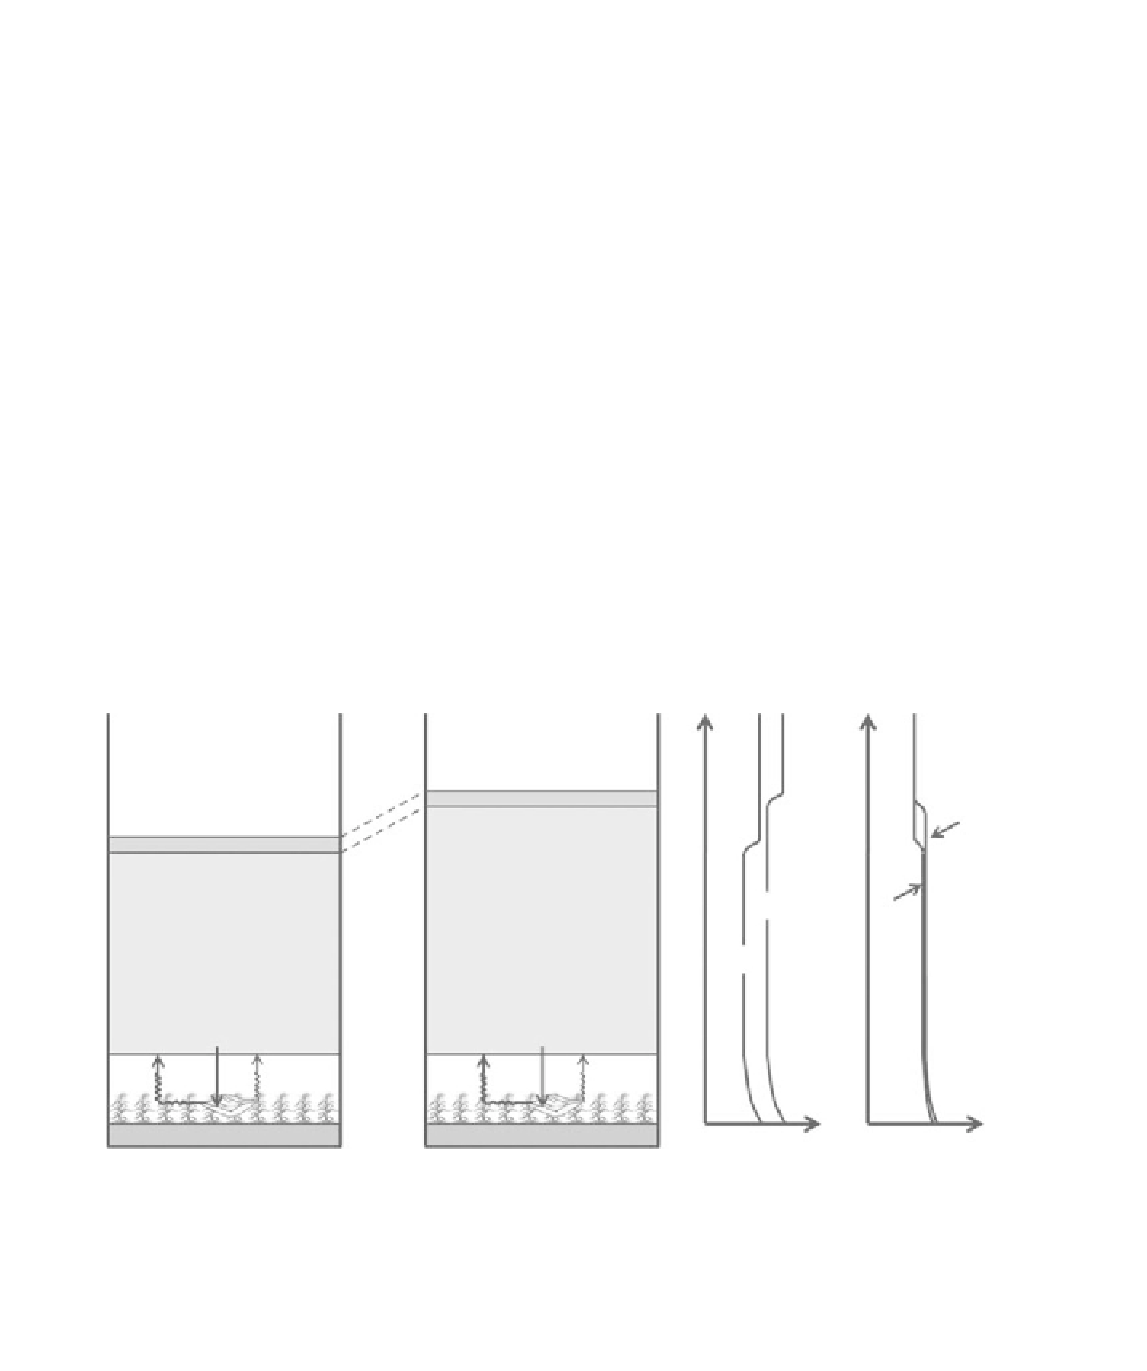
McNaughton and Spriggs (1989) explored the effect of surface-atmosphere
interactions on evaporation rate using a simple 'slab model' (see the section
on low order closure schemes in Chapter 19). The evolution with time of
the ABL represented in the model is illustrated in Fig. 22.10. This slab model
Modeled ABL
(at time
t
)
Modeled ABL
(at time t +
d
t
)
h
h
Free atmosphere
Free atmosphere
Entrainment layer
q
m
(
t
+
d
t
))
Mixed layer
Entrainment layer
Mixed layer
q
m
(
t
+
d
t
))
q
m
(
t
)
Specific humidity =
q
m
(
t
)
Potential temperature =
q
m
(
t
)
VPD =
D
(
t
)
Specific humidity =
q
m
(
t
+
δ
t
)
Potential temperature =
q
m
(
t
+
δ
t
)
VPD =
D
(
t
+
δ
t
)
q
m
(
t
)
l
E
(
t
)
R
n
(
t
)
H
(
t
)
l
E
(
t
+
d
t
)
R
n
(
t
+
d
t
))
H
(
t
+
d
t
))
q
q
Figure 22.10
The simulated growth of the ABL over the time interval
dt
in the McNaughton and Spriggs (1989) slab
model simulation.