Geoscience Reference
In-Depth Information
700
300
250
600
250
500
200
200
400
150
150
300
100
100
200
50
50
100
0
0
0
−
2
−
1
0
23
−
0.5
0
0.5
1
−
0.3
0
0.3
0.6
w
(m s
−
1
)
(K)
w
q
(m s
−
1
K)
q
q
v
′
′
q
v
w
)
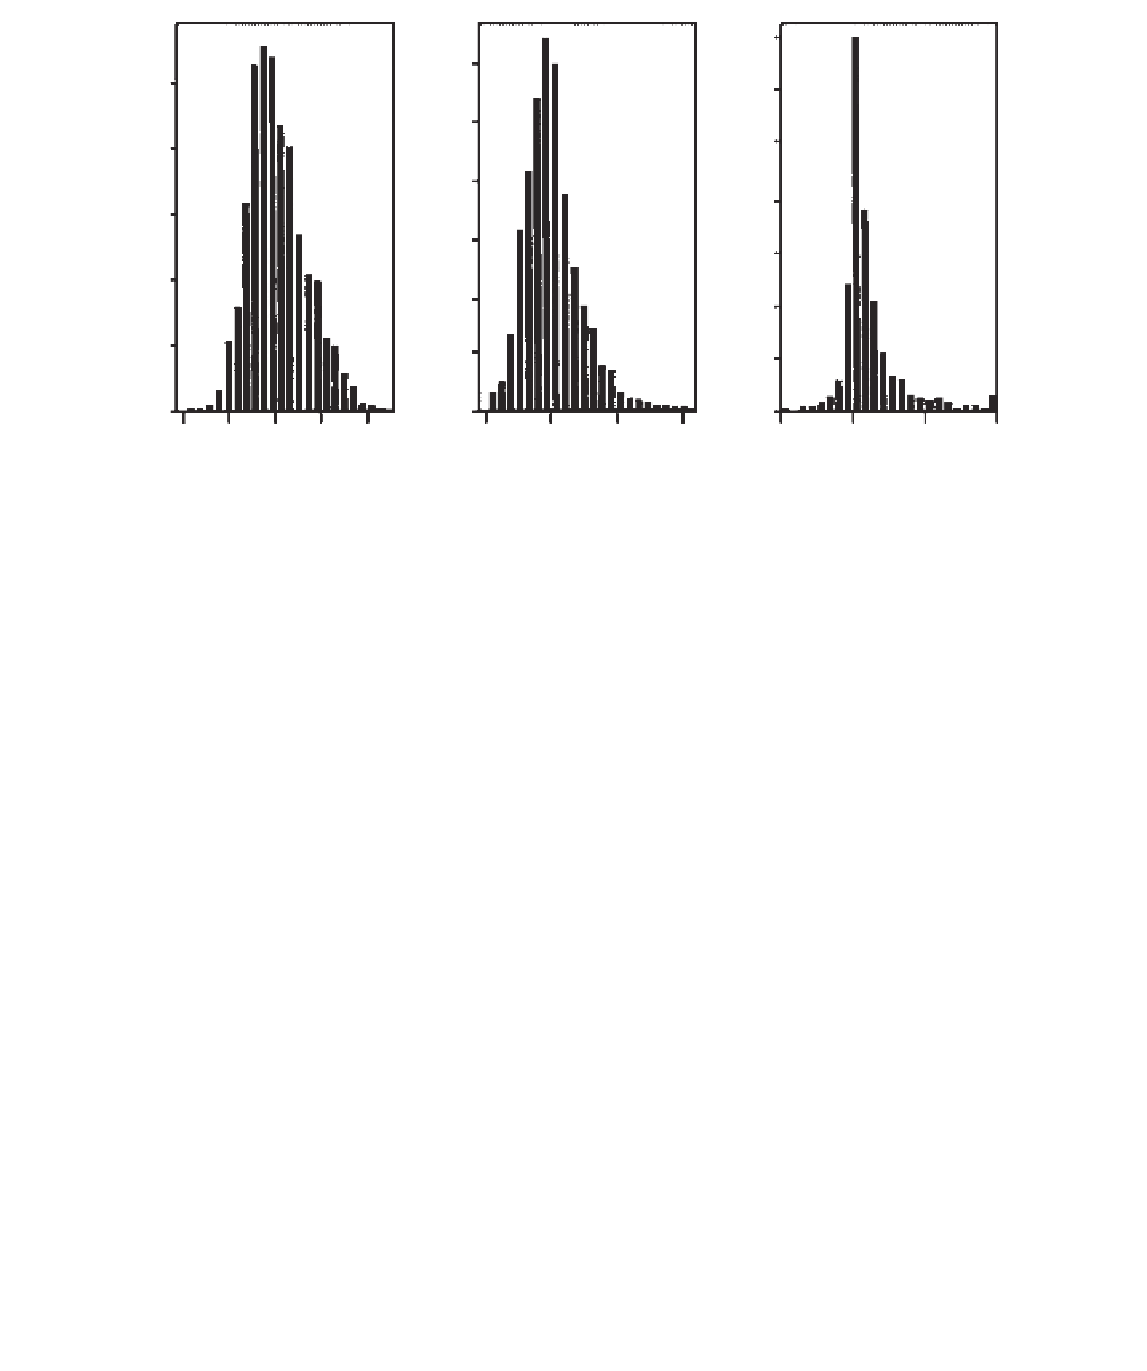
Figure 15.10
Frequency of occurrence of the fluctuations
,
w
, and (
′
in unstable superadiabatic daytime
conditions. (Redrawn from Stull, 1988, published with permission.).
3
2
Figure 15.11
The
normalized flux-angle
distribution of evaporation
for three day's data collected
over a pine forest (positive
flux values only). Updraughts
are positive. (Redrawn from
Gash and Dolman, 2003,
published with permission.).
1
0
1
−
80
−
60
20
Angle of attack on vertical wind sensor
(degrees relative to horizontal)
−
40
−
20
0
40
60
80
evaporation with the angle of the wind vector from the horizontal. There is a
bi-modal distribution with the maximum flux being carried by downward moving
eddies between −5° and −10°, and upward moving eddies between 20° and 25°.
Idealized profiles of turbulent fluxes sensible heat, momentum, and moisture in
daytime and nighttime conditions are shown in Fig. 15.12. During the day the
profiles are large and usually stay roughly constant or change linearly with height
through the ABL. At night the fluxes are much less and fall off rapidly with distance
from the ground.