Geoscience Reference
In-Depth Information
1.2
1.0
0.8
0.6
0.4
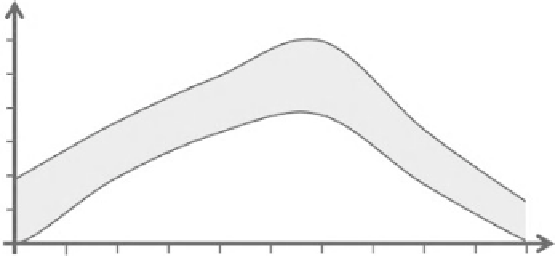
Figure 15.5
A typical
diurnal variation in the range
of values for the linear density
of TKE in the lower
atmosphere.
0.2
0
08:00
10:00
12:00 14:00
Local time of day (hr.)
16:00
18:00
individually. The
Mean Kinetic Energy
,
MKE
, i.e., the energy per unit mass
associated with mean flow in the atmosphere, is given by:
()
u
2
++
()
v w
2
( )
2
MKE
=
(15.17)
2
While the
Turbulent Kinetic Energy
,
TKE
, i.e., the energy per unit mass associated
with turbulent fluctuations in the atmosphere, is given by:
2 2 2
() () ( )
2
u
′+′+ ′
v w
TKE
=
(15.18)
As explained in greater detail in later chapters, the
TKE
is generated in the
atmospheric boundary layer by the mechanical forces acting between the
atmosphere and an aerodynamically rough surface as it moves, and by forces
associated with atmospheric buoyancy, the latter being enhanced in unstable
conditions but suppressed in stable conditions.
TKE
is always being destroyed by
friction in the atmosphere and it is the balance between the rate of production of
turbulence and its destruction which determines the amount of turbulent kinetic
energy present at any point and time. Figure 15.5 shows how the
TKE
typically
changes through the day, while Fig. 15.6 shows typical profiles for
TKE
as a
function of height in different conditions of atmospheric stability.
Linear correlation coefficient
The covariance,
C
A
,
B
, between two variables
A
and
B
is defined by the expression:
(15.19)
C
(
A A B B
)(
)
=−
−
AB
,