Geoscience Reference
In-Depth Information
10
Change in variance
Mean 6 m s
−
1
Mean 5 m s
−
1
5
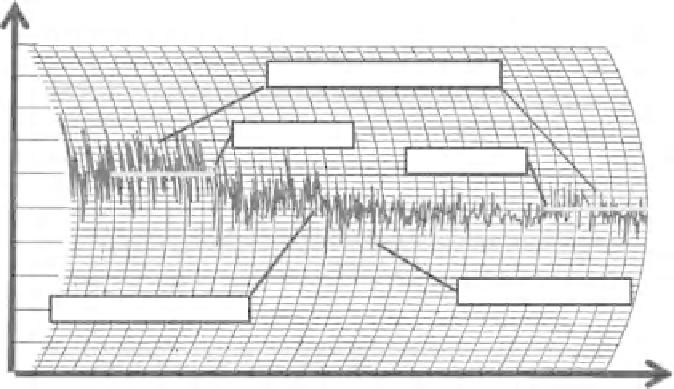
Figure 15.1
Trace of
horizontal wind speed
measured with an
anemometer. (Redrawn
from Stull, 1988,
published with
permission.)
Peaks at about 1 min.
Structure at 3-13 mins
0
12:00
13:00
14:00
Local time
Turbulent structures with different
horizontal dimensions within a body
of air moving horizontally
5
−
6 m s
−
1
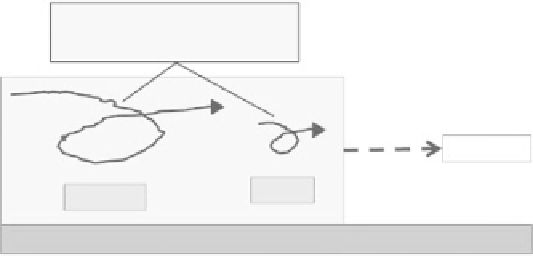
Figure 15.2
Schematic
diagram of turbulent eddies
circulating within an air
stream which is itself moving
at the mean wind speed.
10's m
1000's m
c.
The magnitude of the variability as characterized by variance of the trace
over 30 minutes decreases between 12:00 and 14:30.
d.
There is arguably some evidence of structure in the variations, with small
peaks separated by about 1 minute superimposed on larger peaks at about
3-5 minutes, and some evidence of variations at about 8 to 10 minutes.
Because the measurement is of horizontal wind speed, the fact that there are
periods with faster and slower horizontal wind speed suggests the presence of
structures in the air flow that take about a minute to a few tens of minutes to
pass the fixed sensor. These, therefore, have a horizontal size on the order of
tens to thousands of meters (Fig. 15.2) and are sometimes referred to as
turbulent eddies
.
Thus, observations made with a weather sensor mounted above the ground (in
this case an anemometer) show that there are haphazard variations in the meas-