Geoscience Reference
In-Depth Information
Ascent
Ascent
Decent
Figure 14.11
Schematic
diagram of the hypothetical
variation in correlation
coefficient versus distance for
long term average
precipitation relative to one
location if produced by
randomly occurring
convective storms over a
moist, flat, featureless plain.
~ Storm separation
~ Storm size
Distance
(a)
(b)
Bands
parallel
to coast
On shore
wind
direction
0
Line of the
great
divide
0.5
0.25
0
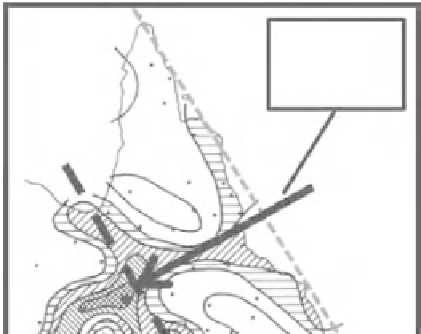
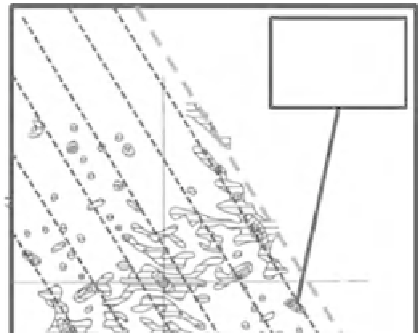
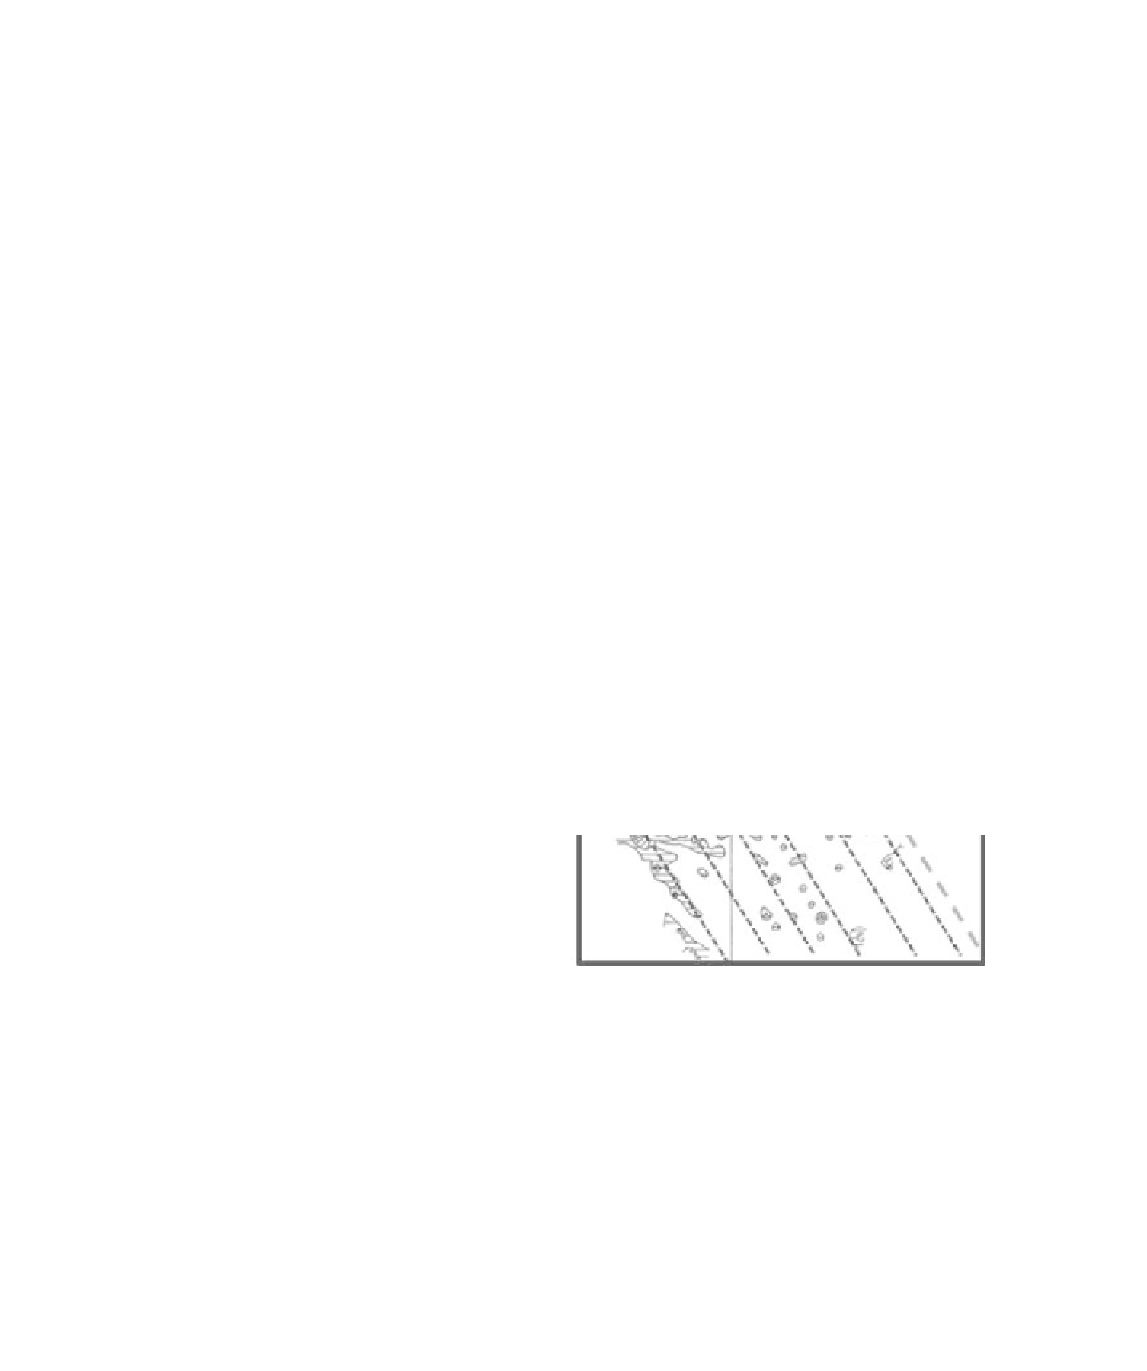
Figure 14.12
(a) Contours of correlation coefficient for observed precipitation in Queensland, Australia relative to a single
point, and (b) contours of composite correlation obtained by superimposing the correlation coefficients for individual
gauges in the same region as (a). (Redrawn from Sumner and Bonell, 1988, published with permission.)
Figure 14.12a illustrates a good example of this for Queensland, Australia. The
contours of the correlation coefficient between one selected inland gauge and other
gauges in the region show the effect of coherence between precipitation measured
along the line of the Great Divide and coastal precipitation associated with sea breeze
activity, and also strong correlation along the dominant direction of moisture flow.