Geoscience Reference
In-Depth Information
Table 13.3
Annual total rainfall at Musoma, Tanzania from 1931 to 1960 ranked in
order of increasing precipitation amount (Data from East African Meteorological
Department, 1966).
Amount
(mm)
Amount
(mm)
Amount
(mm)
Rank
Year
Rank
Year
Rank
Year
1
442
1934
11
713
1941
21
893
1955
2
467
1949
12
714
1932
22
932
1947
3
550
1933
13
760
1945
23
949
1951
4
613
1953
14
772
1956
24
954
1950
5
624
1938
15
774
1940
25
998
1944
6
637
1939
16
782
1952
26
1015
1954
7
646
1931
17
823
1958
27
1026
1937
8
650
1946
18
850
1948
28
1039
1957
9
680
1935
19
852
1942
29
1128
1960
10
711
1943
20
883
1959
30
1184
1936
1000
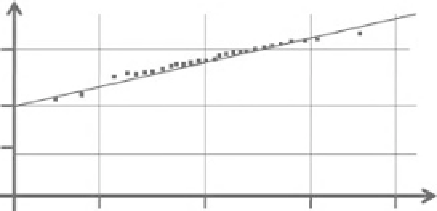
Figure 13.13
Annual total
rainfall at Musoma, Tanzania
between 1931 and 1960 given
in Table 13.3 plotted on
log-normal probability paper
against the notional
probability of each value as
calculated by Equation (3.11).
800
200
100
0%
10%
50%
Estimated percentage probability
90%
99%
approximately normal. By extrapolating the line in Fig. 13.13 (either by eye or by
fitting a linear regression), the probability can be estimated to an annual rainfall
amounts outside the range for which observations are available.
Alternative options for assumed distributions (and associated graph papers)
could be used as alternatives to assuming a normal distribution to give plots
equivalent to Fig. 13.13 for the Grumbel or Pearson distributions. In practice the
selection between these alternative assumptions would likely be made based on
which gave the best appearance of a straight line. But the fact that several different
assumptions can be made and that several give at least reasonable linearity is
significant. It demonstrates the fundamental limitation on the accuracy of the
estimates made using the approach of the statistics of extremes, because the
probability distribution always has to be
assumed
. Perhaps several estimates using