Geoscience Reference
In-Depth Information
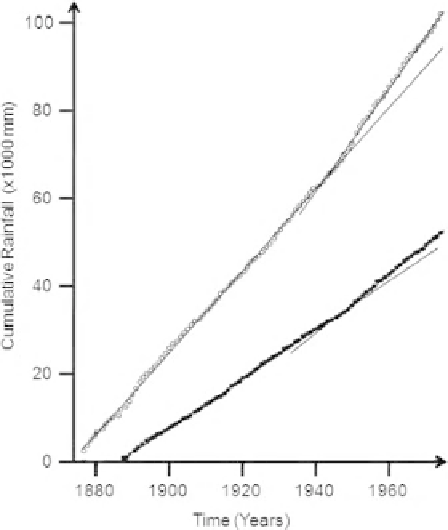
Figure 13.6
Use of the mass
curve to reveal changes in the
annual precipitation at
Cootamundra (open circles)
and Mount Victoria (filled
circles) in New South Wales,
Australia. (Redrawn from
Sumner, 1988, after Cornish,
1977, published with
permission.)
Any distinct and sustained change is revealed by a change in slope of the resulting
graph, which might be quantified by fitting a linear regression to selected portions
of the mass curve. Figure 13.6 shows an example of this type of analysis made at
two Australian sites indicating that there was a noticeable increase in precipitation
at these two sites in the mid-1940s relative to the period 1890 to 1970.
Oscillations in precipitation
Precipitation time series may include periodicity at several different frequencies.
Initial identification of possible contributing periodicity might be sought using
serial autocorrelation. Fo
r
a precipitation time series
P
i
, comprising
N
data points
which has a mean value
P
, the series correlation,
C
L
, for a time lag
L
is given by:
iN
=
∑
(
PPP P
−
)(
−
)
i
i
+
l
C
=
i
=
1
(13.8)
L
iN
=
∑
2
NPP
(
−
)
i
i
=
1
When
L
1. If the time interval between data samples is short (e.g., daily)
the correlation for small time lags may well be significant because successive daily
precipitation amounts are not truly independent. For longer time periods and
=
1,
C
L
=