Geoscience Reference
In-Depth Information
10
4
: 1.4 mm/hr
: 6.2
: 1.4
: 6.4 mm/hr
: 46.5
: 24.0
: 84.0 mm/hr
: 90.5
: 97.0
M-P
5 mm/hr
M-P
1 mm/hr
M-P
100 mm/hr
10
3
M-P
40 mm/hr
M-P
10 mm/hr
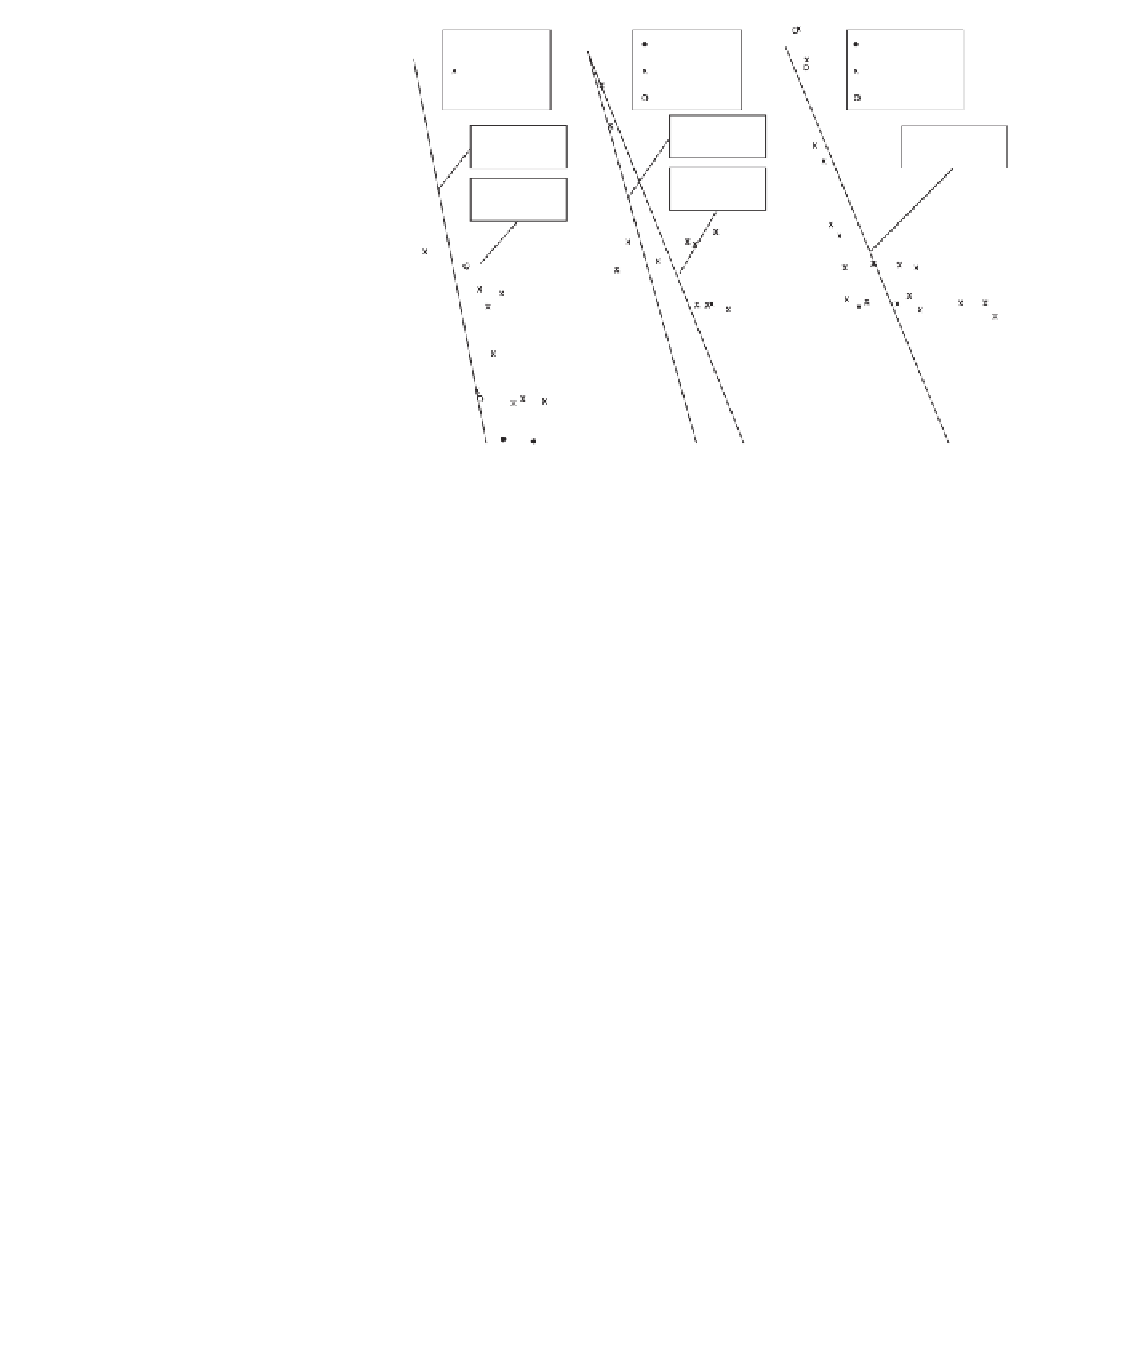
Figure 11.4
An example of
observed raindrop diameter
(
D
) distributions during a
rainfall event in which
rainfall rate changed with
time, together with curves
computed from the Marshall-
Palmer equation. (From
Sumner, 1988, after Shiotsuki,
1974, published with
permission.)
10
2
10
1
0
12301234012345
D
(mm)
Raindrop size distribution
There is always a range of drop sizes present in any individual storm and it is
quite common to have drops that fit the criterion of rain (> 0.5 mm) and drizzle
(<0.5 mm) in the same storm. Observational studies of drop size distributions
reveal that for drops with diameter greater than 1 mm, the number of drops is
often found to fall off exponentially at a rate which is approximately related to
the rainfall rate and follows the Marshall-Palmer equation, which has the form:
ND N
l
−
(11.3)
()
=
e
D
o
where
N(D
) is the number of drops of diameter
D
per unit volume,
D
is the drop
diameter in millimeters,
N
o
is a constant in drops per cubic meter per millimeter
of drop diameter, and
l
D
, is a function of rainfall intensity. In this expression, typi-
cal empirical values might be
N
o
∼
8000 drops m
−3
mm
−1
and
l
D
≈ 4.1
R
−0.21
, where
R
is the rainfall rate in mm hr
−1
.
Figure 11.4 shows observed forms of drop size distribution at different rainfall
rates that are typical of those found for a young cloud. Older clouds tend to
provide less small drops because the bigger drops in the cloud will have grown
preferentially at the expense of smaller drops. However, the largest drops, with
diameters greater than 3 mm for example, can become unstable, and older clouds
may therefore give raindrops which are the smaller fragments created when
large drops break up.