Environmental Engineering Reference
In-Depth Information
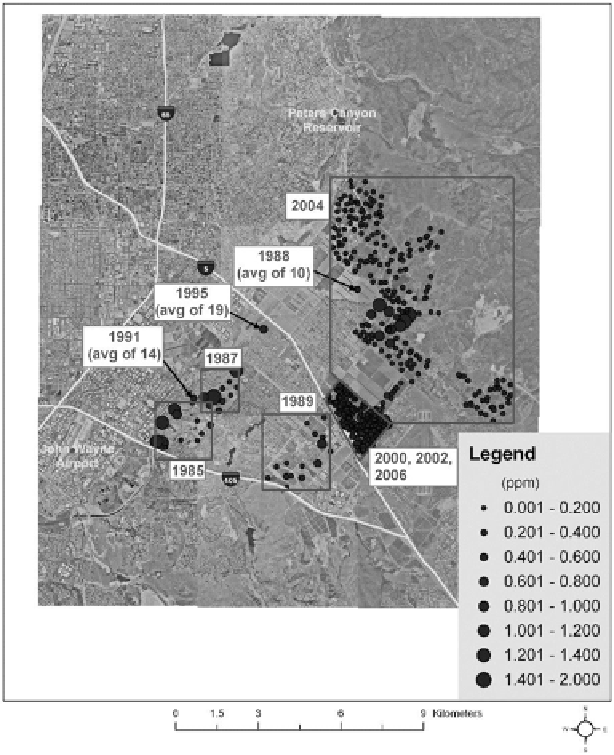
Fig. 2
Locations of agricultural soil samples analyzed for DDT. Data were from unpublished
technical reports provided by The Irvine Company (1985-2006). The aerial photo is a composite
of photos taken in 1994 and 1995
3.1.2
Sediments
Sediment data are plotted in Fig.
3
for Lower and Upper Newport Bay for the period
1980 through 2011. There are no data available for the period from 1987 to 1995.
Bay-wide trends in sediment DDT concentration over time are diffi cult to infer
from these data for several reasons. First, sampling was conducted by multiple
agencies, using multiple methodologies, at varying locations and sample depths.
Given this diversity in sampling approach and location, direct comparisons between
data from year to year are inappropriate. Second, there is signifi cant movement of
sediment into, out of, and within the Bay such that even samples taken in the same
Search WWH ::

Custom Search