Travel Reference
In-Depth Information
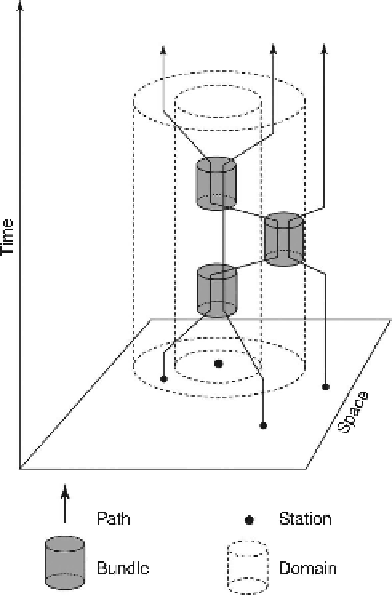
Visualisation of space-time paths
One of Hägerstrand's most profound professional and disciplinary achievements was the
ability to represent space and time in a single diagram (Gren, 2001), unlike an ordinary map,
but rather like a snapshot, that reproduces a moment frozen in time. The result was his, now
famous, time-geographic diagrams: notational (representational) systems, which formed the
basis of much of the subsequent work in the fi eld of time geography, particularly in the realm
of analysis and interpretation. The diagrams (see
Figure 22.1,
taken from Gregory, 1989)
consist, as a rule, of two axes: a time-axis and a space-axis, thus making it possible to trace in
graphic terms individual time budgets. The effective range of each person is described by a
prism, or a series of prisms, whose shape is dependent upon the aforementioned capability
constraints. Hence, every pause, regardless of the activity involved, will cause the prism's (or
sub-prism's) range to shrink in direct proportion to the time spent at said stop. But there are
also other wider structural features, specifi c to the social systems within which individuals
operate, which, as has long been recognised, help shape people's time budgets and activity
patterns.
As long as most of the work in time geography was primarily theoretical, there was little
problem in presenting of time-space activity in such a manner. Indeed, the majority of studies
published in the 1970s and 1980s presented one, two or, at the most, four sequences (see, for
example, Parkes and Thrift, 1980). The method was until recently less suited for empirical
research purposes, where there is often a need to incorporate a large number of sequences on
the dual axis. In such cases, several problems arise: some visual, others analytical. To begin
Figure 22.1
Hägerstrand's time-geographical diagram