Geography Reference
In-Depth Information
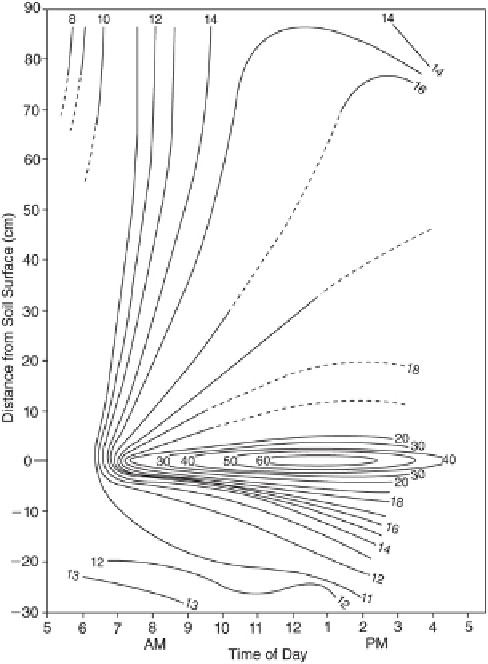
FIGURE 3.13
Vertical profile of soil and air temperatures (°C) under clear skies on a well-drained
alpine tundra surface at 3,580 m (11,740 ft) in the White Mountains of California. Note the tre-
mendous gradient occurring immediately above and below the soil surface. The slightly higher
temperatures at a depth of 25-30 cm (10-12 in.) are a result of the previous day's heating and are
out of phase with present surface conditions. (After Terjung et al. 1969: 256.)
Such a temperature regime stands in great contrast to that of tropical mountains.
Figure 3.14b shows the temperature characteristics of Quito, Ecuador, on the equator at
an elevation of 2,850 m (9,350 ft). The isotherms on the graph are oriented vertically, in-
dicating very little change between winter and summer, but a marked contrast between
day and night. The average annual range is less than 1°C (1.8°F), while the average
daily range is approximately 11°C (19.8°F). This beautifully demonstrates the saying,
“Night is the winter of the tropics.” This is particularly true if the station is high enough
for freezing to occur.
The lower limit of frost is determined principally by latitude, mountain mass, contin-
entality, and the local topographic situation. In the equatorial Andes, it is at about 3,000
m (10,000 ft). The elevation of this limit decreases with latitude; the point where frost
begins to occur in the lowlands is normally taken as being the outer limit of the tropics.
In North America, the frost line runs through the middle of Baja California and eastward
Search WWH ::

Custom Search