Biomedical Engineering Reference
In-Depth Information
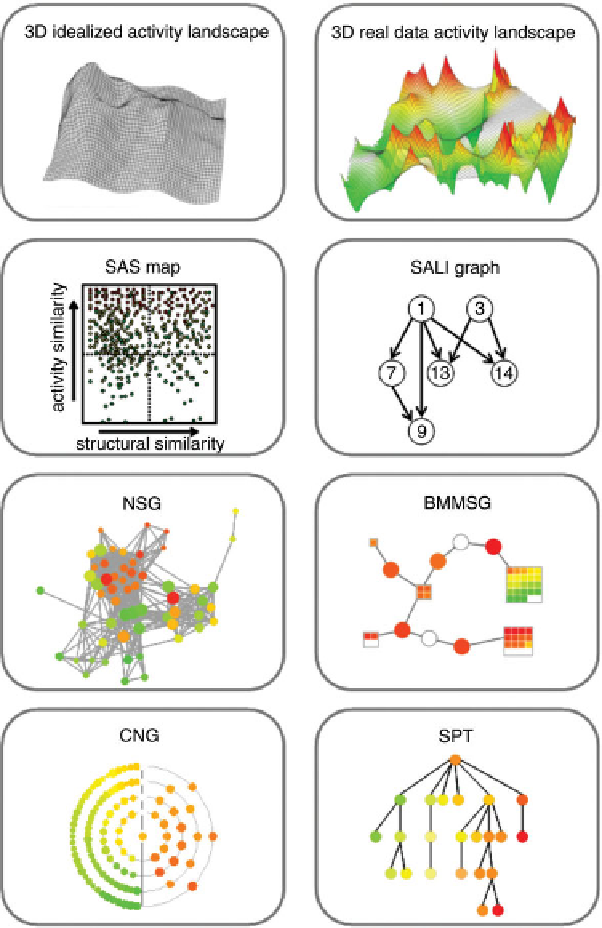
FIGURE 16.1
Activity landscape representations. Alternative activity landscape views are
shown. Details are discussed in the text. For the SALI graph, NSG, and BMMSG, small
representative sub-graphs are displayed that are taken from larger graphs of compound data
sets. (
See insert for color representation of the figure
.)