Biomedical Engineering Reference
In-Depth Information
(a)
(b)
(c)
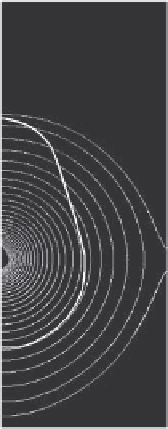
FIGURE 1.14
Temporal evolution of isotherms (interval 5
◦
): (a) 60 sec, (b) 300 sec, and
(c) 600 sec.
ω
eff
= 0.004/sec (low perfusion) and 0.040/sec (high perfusion) are illustrated
in Figures 1.15(a) and 1.15(b), respectively, along with the curve analytically
obtained by integrating the ordinary differential equation (1.95). The figures
may also be used to know the time required to kill the circular tumor of radius
R
i
. The numerical results obtained for these two cases in the figures clearly
show that the limiting radii
R
lim
for
ω
eff
= 0.004/sec and 0.040/sec are around
29.9 mm and 12.8 mm, respectively, which are estimated on the basis of the
analytical expression (1.99).
Finally, the curve representing the limiting radius is generated from equa-
tion (1.99) and plotted against the effective perfusion rate in Figure 1.16. We
learn from the figure that a single probe, even when placed in the center of the
target, is capable of freezing only the size of a tumor whose equivalent radius
is less than the limiting radius,
R
lim
. The figure indicates that, for the case of
comparatively high perfusion rate, a single probe of radius 1 mm can freeze a
tumor only within the radius of 20 mm or less. This is consistent with the fact
reported by Nakatsuka et al. (2004). In practice, we may introduce a factor
λ
and estimate the range of the killed tissue by
r
λR
lim
. The factor
λ
has to
be chosen carefully, depending on the specific clinical and surgical constraints,
such as the number of cryoprobes available, the time set for a single freezing
process, and the level of malignancy.
≤


Search WWH ::

Custom Search