Biomedical Engineering Reference
In-Depth Information
(a)
(b)
250
250
250
Pe
= 10
132.379
200
91.299
200
54.533
150
200
175
150
Ra
σ
100
22.752
150
50
125
100
0
Pe
= 10
Ra
cr
=103.374
50
-50
0
5
10
15
20
0
5
10
15
20
Wave number
k
Wave number
k
s
at different
Ra
Tendency curve of
s
m
Marginal curve of
Pe
= 10
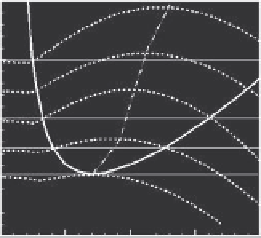
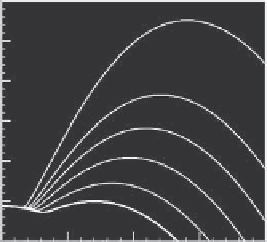
FIGURE 14.4
(a) Growth rate versus
k
for different Rayleigh number at
Pe
= 10. (b) Vari-
ation of growth rate in the stability diagram for
Pe
= 10.
in Figures 14.4(a) and 14.4(b), the growth rate varies with the wavenumber
within this range to attain a maximum value
σ
M
at a wavenumber
k
M
, which
is always greater than the critical wave number
k
m
. We also note from Figures
14.5(a) and 14.5(b) that
k
M
and
σ
M
increase as
Ra
is increased. Figure 14.5(c)
shows a universal curve
σ
M
versus Ra
when
Pe
1 while Figure 14.5(d)
represents the variations of the renormalized growth rate
σ
∗
M
for
Pe
≤
2. It is
noted that results presented here are obtained from the linear stability analysis
of small perturbations. In other words, they are only valid at the very early
development of convection. The subsequent evolution of the concentration and
flow patterns are determined by nonlinear interactions and should be studied
by solving the full set of governing equations.
≥
14.2.3.2
Evolution of Bioconvection
14.2.3.2.1
Critical Threshold and Subcritical Regime
First simulations were presented for small values of swimming speed
Pe
=0
.
001
,
0
.
1, and 1. According to linear analysis, the critical Rayleigh
numbers are calculated by (14.28) for
Pe
≤
1 and by renormalization, estab-
lished for
Pe
2 as mentioned earlier. In Table 14.1, we compare the two
series of critical Rayleigh number values found by both methods (linear sta-
bility analysis and numerical simulation) for Peclet numbers from 0.1 to 10.
We recognize that for the case of
Pe
=0
.
001, the results are very close to
the ones obtained for thermoconvection under the constant flux heating condi-
tion (Figure 14.6(a)). When the swimming speed is increased, the unicellular
convection core begins to shift (Figure 14.6(c)) toward the sidewalls.
≥


Search WWH ::

Custom Search