Biomedical Engineering Reference
In-Depth Information
(c
1
)
0
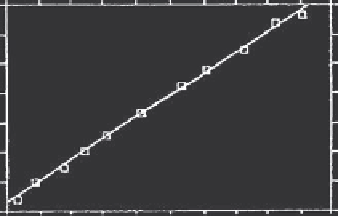
-4.0e+08
-8.0e+08
C
B
A
-1.2e+09
I
= 9 A
-1.6e+09
-2.0e+09
-2.4e+09
0
0.001
0.002
0.003
0.004
0.005
0.006
0.007
0.008
u
2
/m
2
sec
-2
(c
2
)
-8.0e+08
-1.0e+09
-1.2e+09
-1.4e+09
-1.6e+09
I
= 9 A
-1.8e+09
-2.0e+09
-2.2e+09
0.001
0.0014
0.0018
0.0022
0.0026
0.003
u
2
/m
2
sec
-2
FIGURE 12.4
(Continued)
where
K
e,i
is the elutriation rate constant for particles of size
i
,d
pi
is the
diameter of particles of size
i
,
µ
is the air viscosity,
u
o
is the superficial air
velocity,
u
ti
is the terminal velocity of particles of size
i
, and
Re
ti
is the
terminal Reynolds number for particles of size
i
. Experimental data is shown
in Figure 12.5.
Rosensweig and coworkers (Rosensweig et al. 1981b) have studied the
arrangement of the particles in a MSFB and concluded that it can be quan-
titatively correlated by a number that they denominated
E
G
, which is an
adimensional number defined as
E
G
=
24
ρ
S
gd
p
µ
0
H
p
(12.17)
where
H
p
is the apparent applied magnetic field acting on the particles due
to their magnetization.
When
E
G
<
1, the particles align with the field lines and form chain-like
structures that create the tunneling effect (due to the strong magnetization).
For
E
G
>
10, the structure looks random and compact with no preferred ori-
entation. When 1
<E
G
<
10, the bed is partially structured.


Search WWH ::

Custom Search