Biomedical Engineering Reference
In-Depth Information
2
1.5
1
0.5
0
0.2
0.4
0.6
0.8
r
/
R
FIGURE 10.4
Distribution of pressure as a function of radius (Reynolds number = 70,000).
Dashed line: microcosm of Gust (1990), solid line: multiring device of Khalili
and Javadi (2009). The latter device produces an almost constant gradient
and lower pressures compared to that of Gust.
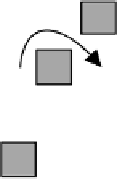
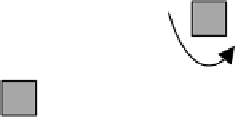
(a)
(b)
T
= 1
T
> 1
FIGURE 10.5
Comparison of free flow (a) to tortuous flow through a porous structure.
Unfortunately a direct measurement of tortuosity is not possible.
This fact has led to diffusive (Nakashima and Yamaguchi 2004), electri-
cal (Lorenz 1961), and acoustic (Johnson et al. 1982) tortuosity definitions.
There were also further theoretical attempts by Koponen et al. (1996) to
define tortuosity. However, all these tortuosities, in general, differ from each
other. Except for some very simple models (Clennell 1997; Knackstedt 1994;
Zhang and Knackstedt 1995), there is no clear consensus on its definition. In
the literature, so far four different models for tortuosity have been provided


Search WWH ::

Custom Search