Biomedical Engineering Reference
In-Depth Information
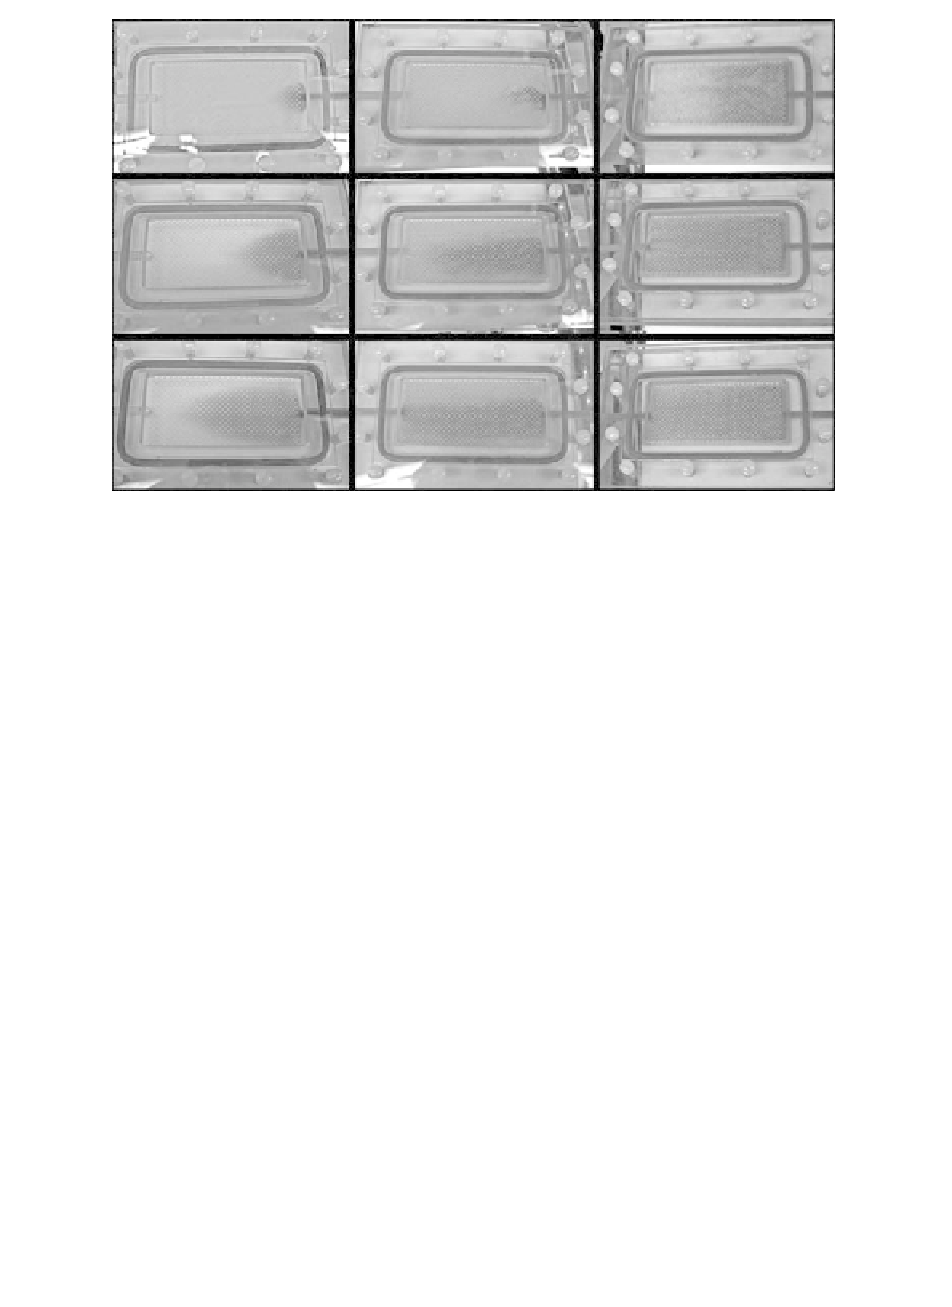
FIGURE 5.8
Images of flat-plate porous media reactor systems during representative times
of tracer studies. Left column: clean reactor before inoculation; center col-
umn: constant flow system after 7 days; right column: constant head system.
Duration from time of tracer injection increases from top to bottom of each
column. The pictures correspond to the day 7 tracer curves in Figure 5.7.
acceptor (i.e., oxygen) availability limited biofilm growth and activity. To cir-
cumvent electron acceptor availability-related limitation of biofilm growth, a
fermentative microorganism,
Cellulomonas
sp. strain ES6 (Sani et al
.
2002;
Smith et al
.
2002; Viamajala et al
.
2008) was utilized in the studies summa-
rized in Figures 5.7 and 5.8.
A comparison of biofilm development and its influence on hydrodynam-
ics between constant head and constant flow conditions becomes immediately
obvious. The tracer breakthrough characteristics in the clean (not biofilm-
affected) reactors are similar for the constant head and constant flow condi-
tions (Figure 5.7). However, differences in the characteristics of tracer break-
through become obvious very quickly (compare images in Figure 5.8, taken
after 7 days in both reactors). Under constant flow conditions significant
changes in tracer breakthrough characteristics become obvious after 7 days,
when the initial breakthrough of tracer occurs very quickly, indicating a signif-
icant reduction in effective porosity. In addition, some of the dye injected tends
to remain in the biofilm-affected constant flow reactor for an extended period
Search WWH ::

Custom Search