Biomedical Engineering Reference
In-Depth Information
Oxygen concentration (mol m
-3
)
0.20
mean value
0.15
0.10
0.05
0
Case 1
(Static)
Case 2
(Higher
Case 3
(Lower
Case 4
(Higher
τ
w
)
τ
w
)
τ
w
)
Physiologic*
hinner tissue
hicker tissue
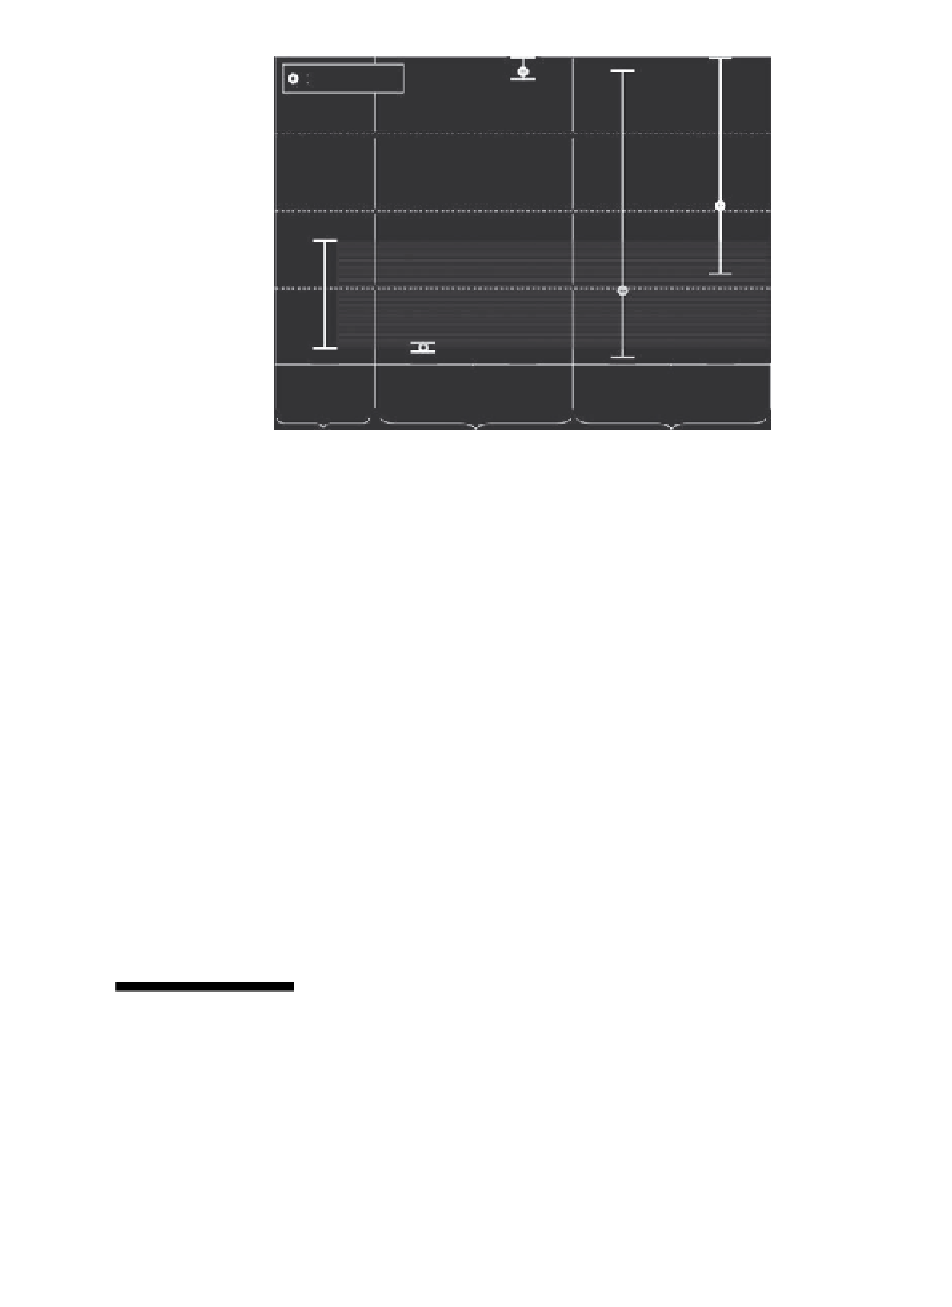
FIGURE 3.15
Range (illustrated by bars) of computed oxygen concentrations in the tissue
at
t
36 h, for each culture case. The open circles on these bars represents the
mean value (surface averaged value) on the overall tissue. The term “Physio-
logic*” corresponds to normoxia values reported by Obradovic et al. (1999).
≈
control (case 1) is close to the lower boundary of the
in vivo
range, whereas
during the stimulation phase (case 2) the thin tissue is under a hyperoxy-
genation state. For the thick tissue, on the contrary, the low shear conditions
(case 3) present more similitude with the physiologic state as compared to
the high shear conditions (case 4): roughly two-third versus only one-fourth
of the tissues are under normoxic conditions, respectively. Finally, the thick
tissues (cases 3 and 4) present a wider range of oxygen concentrations than
those present in the thin tissues (cases 1 and 2). This is owing to the extent
of the domain of oxygen consumption.
3.6 Conclusion
As recalled here, a variety of perfusion systems have been recently proposed in
an effort to enhance the development of three-dimensional tissue constructs
in
vitro
. Nevertheless, tissue engineering remains actually limited by our lack of
knowledge and technological means of quantification in transport phenomena
within biological tissues as well as cell mechanotransduction response and
Search WWH ::

Custom Search