Biomedical Engineering Reference
In-Depth Information
10
9
8
7
6
5
4
3
2
1
0
Series 1
Series 2
Series 3
135 79 1 3 5 7 9
Randomly selected number of patients
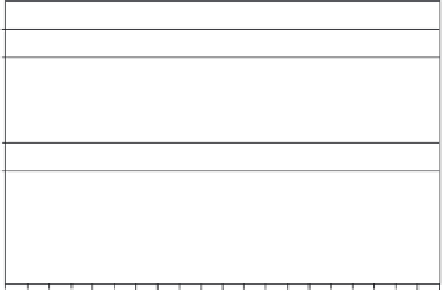
Figure 19.2.
Graphical impact of 2 units of cord blood transfusion on the host after 72 hours
and 7 days. Series 1: pre-transfusion haemoglobin in gm/dl. Series 2: post-transfusion haemo-
globin in gm/dl after 72 hours. Series 3: post-transfusion haemoglobin in Gm/dl after 7 days.
1.5
1
0.5
Series 1
Series 2
0
1
3579
Randomly selected number of cases
11
13
15
17
19
Figure 19.3.
Graphical impact of 2 units of cord blood transfusion on the host's creati-
nine level as seen after 72 hours. Series 1: pre-transfusion Creatinine in mg/dl. Series 2: post-
transfusion Creatinine in mg/dl after 72 hours.
(Figure 19.3), urea (Figure 19.4), glucose (Figure 19.5), bilirubin (Figure 19.6), on
the recipients of two units of cord blood, when compared to the pre-transfusion
level. There was also an improvement of appetite and a sense of well being in all
the recipients of cord blood transfusion [Bhattacharya (32)].
In yet another study, 92 units of ABO matched HLA mismatched cord blood
transfusion were made to combat severe anemia in the background of beta
thalassemia (hemoglobin concentration varying from 3.5 to 5.9 g/dl with mean
hemoglobin 4.6 g/dl). This transfusion was extremely effective in 14 patients as
an emergency substitute of adult conc. RBC transfusion (male : female ratio 1 : 1,
age varying from six months to 38 years). In this series, the collection of the blood


Search WWH ::

Custom Search