Biomedical Engineering Reference
In-Depth Information
103 +/
16 mg SD of albumin excretion per gram of creatinine in 24-hour excre-
tion of urine in Group B (pretransfusion mean excretion was 193 +/
−
21 mg). Uni-
variate analysis using Fisher's exact test was performed for the results of Groups
A and B. The difference between Group A and B values and its comparison with
the pre-transfusion microalbuminuria appeared to be statistically signifi cant
(p
−
.003). No clinical, immunological or non-immunological reaction has been
detected so far in either group [Bhattacharya (31)].
In another study, cord blood transfusions were tested in 39 patients with
severe anemia of which 22 patients were infected with Plasmodium falciparum
and 17 patients with Plasmodium vivax. For inclusion in this study, too, the
patient's plasma hemoglobin had to be 8 gm% or less. The pre-transfusion hae-
moglobin in the malaria infected patients in this study varied from 5.4 gm/dl to
7.9 gm/dl for falciparum infection and 6.3 gm/dl - 7.8 gm/dl in vivax - infected
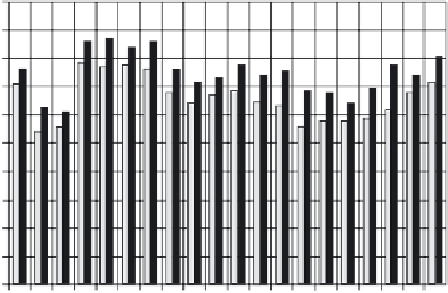
patients. The rise of haemoglobin as estimated after 72 hours of the transfusion
of two units of cord blood was 0.5 gm/dl to 1.6 gm/dl (Figure 19.1). What is inter-
esting is the fact that there was a slow but sustained rise of haemoglobin on the
seventh day after transfusion (series 3).
A univariate analysis using Fisher's exact test was performed for the results
of Series 2 (rise of haemoglobin after 72 hours from pre-transfusion value) and
Series 3 (rise of haemoglobin after seven days from pre-transfusion value). The
difference between Series 2 and Series 3 values and its comparison with the
pre-transfusion haemoglobin appeared to be statistically signifi cant (p
<
.003).
This effect could be due to the bone marrow stimulating effect of the different
cytokine systems of the placental blood (Figure 19.2). No immunological or
non-immunological reaction or adverse metabolic impact on the recipient has
been encountered so far. There was no detected change of serum creatinine
<
10
9
8
7
6
5
4
3
2
1
0
Series 1
Series 2
135 79 1 3 5 7 9
Randomly selected number of cases
Figure 19.1.
Graphical impact of 2 units of cord blood transfusion on the host after 72 hours.
Series 1: pre-transfusion haemoglobin in gm/dl. Series 2: post-transfusion haemoglobin in
gm/dl (after 72 hours).


Search WWH ::

Custom Search