Biomedical Engineering Reference
In-Depth Information
RFSC
BioSC AXIAL
-0.4
(4)
BioSC RADIAL
(3)
RBSC
(2)
-0.8
-1.2
(1)
-1.6
(6)
(5)
-2
-2.4
1
0.8
0.6
SiC Volume fraction
0.4
0.2
0
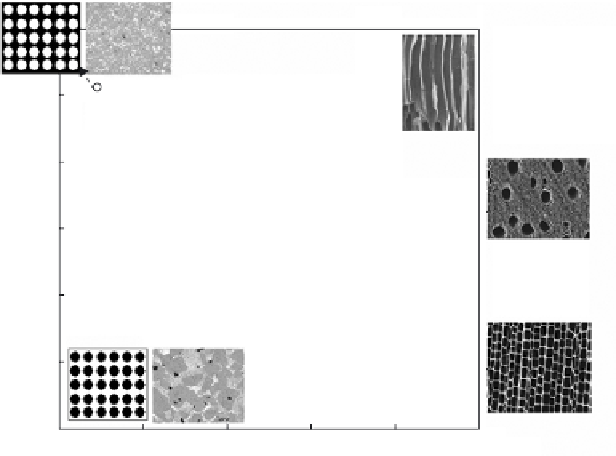
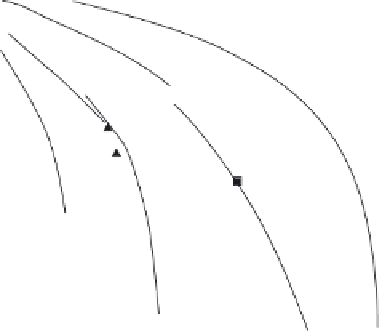
Figure 11.17.
Theoretical values of the relative strength versus the volume fraction of SiC ex-
pected from the minimum solid area model, for ideal microstructures of (solid lines): spherical
particles in rombohedral stacking (1), spherical particles in cubic stacking (2), spherical pores in
cubic stacking (3), tubular pores aligned in the testing direction (4), cylindrical pores in random
stacking perpendicular to testing direction (5), and square shaped tubular pores perpendicular
to testing direction (6). The experimental values are also included. Each family of experimental
values is connected with arrows (dashed lines) to drawings and micrographs of the ideal and
real microstructures. See text for further discussion.
In Figure 11.17 [Martínez, 2003] it has been plotted, together with the experi-
mental relative strength, the expected theoretical values for ideal microstructures
composed of spherical particles in cubic stacking, spherical particles in rhombo-
hedral stacking, spherical pores in cubic stacking, tubular pores aligned in the
testing direction, cylindrical pores perpendicular to testing direction in random
stacking, and square shaped tubular pores perpendicular to testing direction
[Rice, 1996; Rice, 2000]. The theoretical curves are slightly displaced to make the
extrapolation to zero porosity of the experimental relative strength intersect
the origin of these curves. The reason for this displacement is that the strength of
the SiC contained in siliconized SiC may be different to the strength of the fully
dense
-SiC used to calculate the relative strength.
In the case of reaction bonded silicon carbide (RBSC), the microstructure
of SiC grains can be best modeled as a stacking of spherical particles. This
ideal microstructure loses connectivity for porosities ranging from 26% to 52%
depending on the type of stacking of the spherical particles. The strengths
obtained in this work are located in-between these curves (curves one and two in
α


Search WWH ::

Custom Search