Biomedical Engineering Reference
In-Depth Information
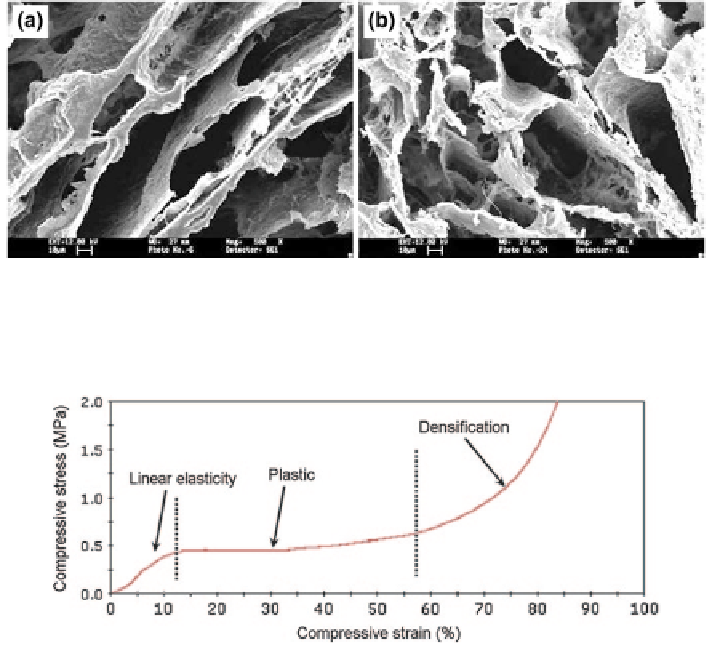
Fig. 3.4
SEM micrographs of PHB scaffolds fabricated from:
a
5 % PHB emulsion and
b
7.5 %
(w/v) PHB emulsion
Fig. 3.5
Typical compressive curve of the 10 % (w/v) PHBV scaffolds. Region I: Linear elastic-
ity; Region II: Plateau; Region III: Densification
used to align the structural elements both in the form of three-dimensional porous
structures and two-dimensional oriented surface patterns (Zhang et al.
2005
;
Sultana and Wang
2008a
,
b
).
Figure
3.4
shows the SEM micrographs of the PHB scaffold produced from
a PHB/chloroform/acetic acid mixture with a polymer concentration of 5 and
7.5 % (w/v). The microstructure of the PHB scaffold was similar to that of
PHBV scaffold fabricated from the same concentration and same processing
parameters.
Typical compressive stress-strain curve for one single scaffold (10 % w/v) is
given in Fig.
3.5
. The compressive properties of the PHBV scaffolds increased
with the increasing emulsion concentration. The scaffolds of 7.5 % (w/v) poly-
mer solution had the compressive modulus of 1.4
±
0.61 MPa in the 2.5-7.5 %
strain range whereas the scaffolds of 12.5 % (w/v) had the compressive modulus
of 6.41
±
1.03 MPa in the same strain range. The typical compressive stress-strain
curves have the three regions as shown in Fig.
3.5
. From Fig.
3.5
, it was observed
Search WWH ::

Custom Search